Figure 10
Download original image
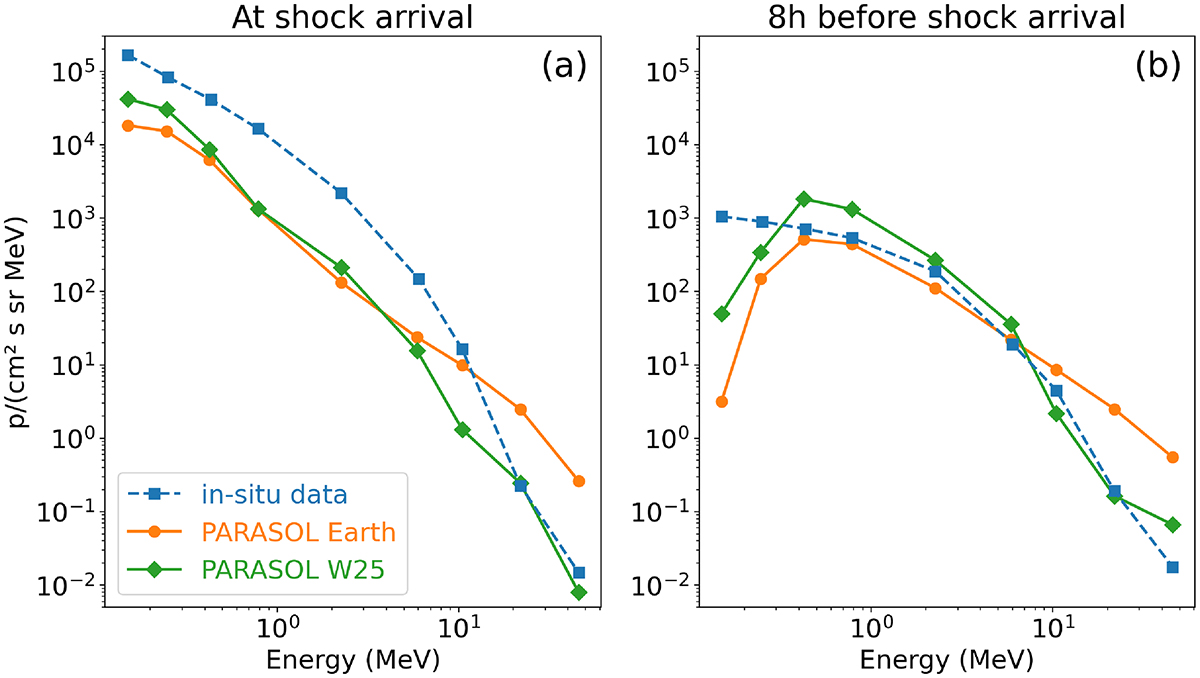
Energy spectra of observed and simulated proton intensities for the 12 July 2012 ESP event. Panel (a) presents the energy spectrum at the shock arrival, while panel (b) displays it eight hours before the shock arrival. Solid lines represent simulated intensities, with the orange line indicating Earth and the green line representing the W25 observer. Dashed lines correspond to in-situ data from ACE and SEPEM, as also depicted in panel 1a of Figure 9.
Current usage metrics show cumulative count of Article Views (full-text article views including HTML views, PDF and ePub downloads, according to the available data) and Abstracts Views on Vision4Press platform.
Data correspond to usage on the plateform after 2015. The current usage metrics is available 48-96 hours after online publication and is updated daily on week days.
Initial download of the metrics may take a while.