Open Access
Figure A1
Download original image
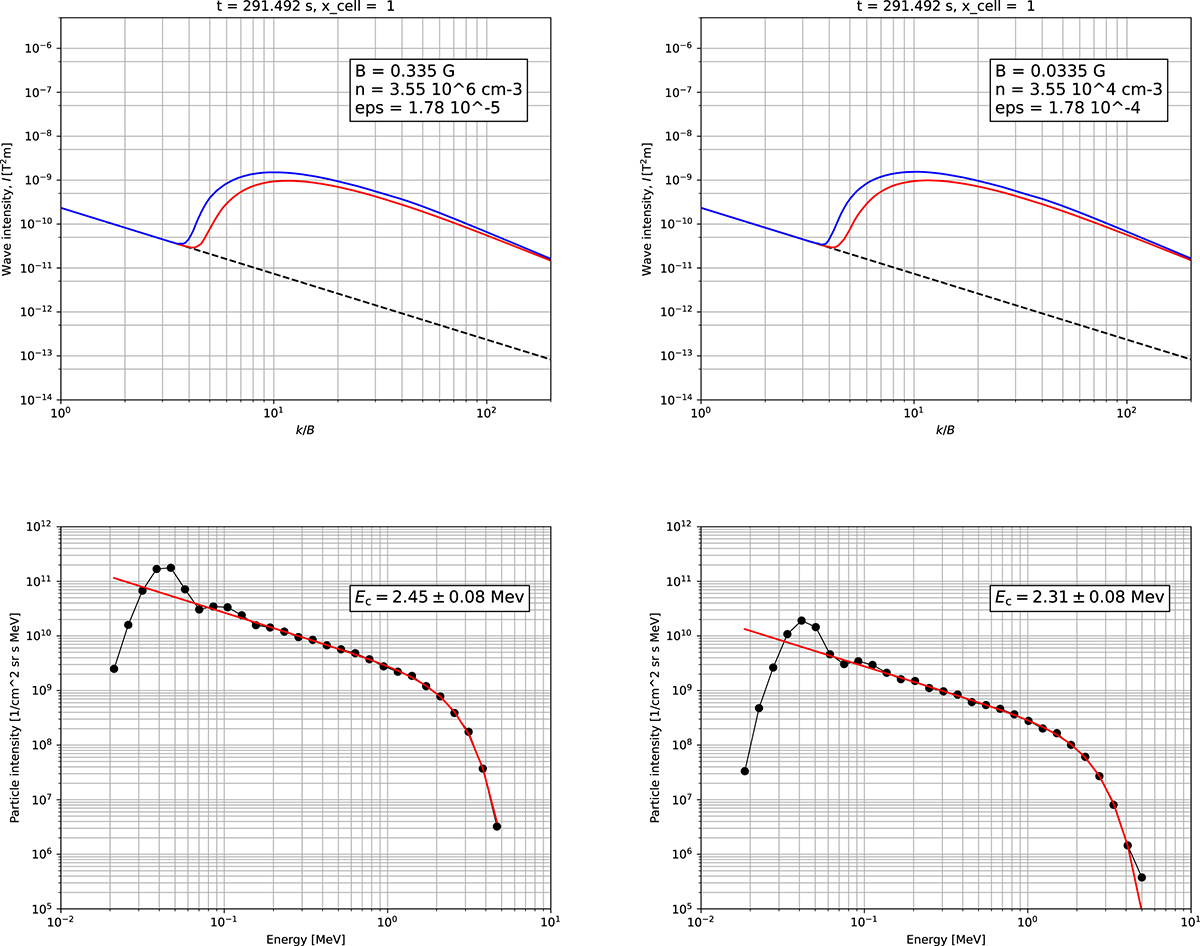
Comparison of the Alfvén wave spectra (the blue and red lines depict the opposite circular polarizations) in the vicinity of the shock (top row) and the proton spectra at the shock (bottom row) resulting from two simulation runs to test the scaling property of the SOLPACS equations.
Current usage metrics show cumulative count of Article Views (full-text article views including HTML views, PDF and ePub downloads, according to the available data) and Abstracts Views on Vision4Press platform.
Data correspond to usage on the plateform after 2015. The current usage metrics is available 48-96 hours after online publication and is updated daily on week days.
Initial download of the metrics may take a while.