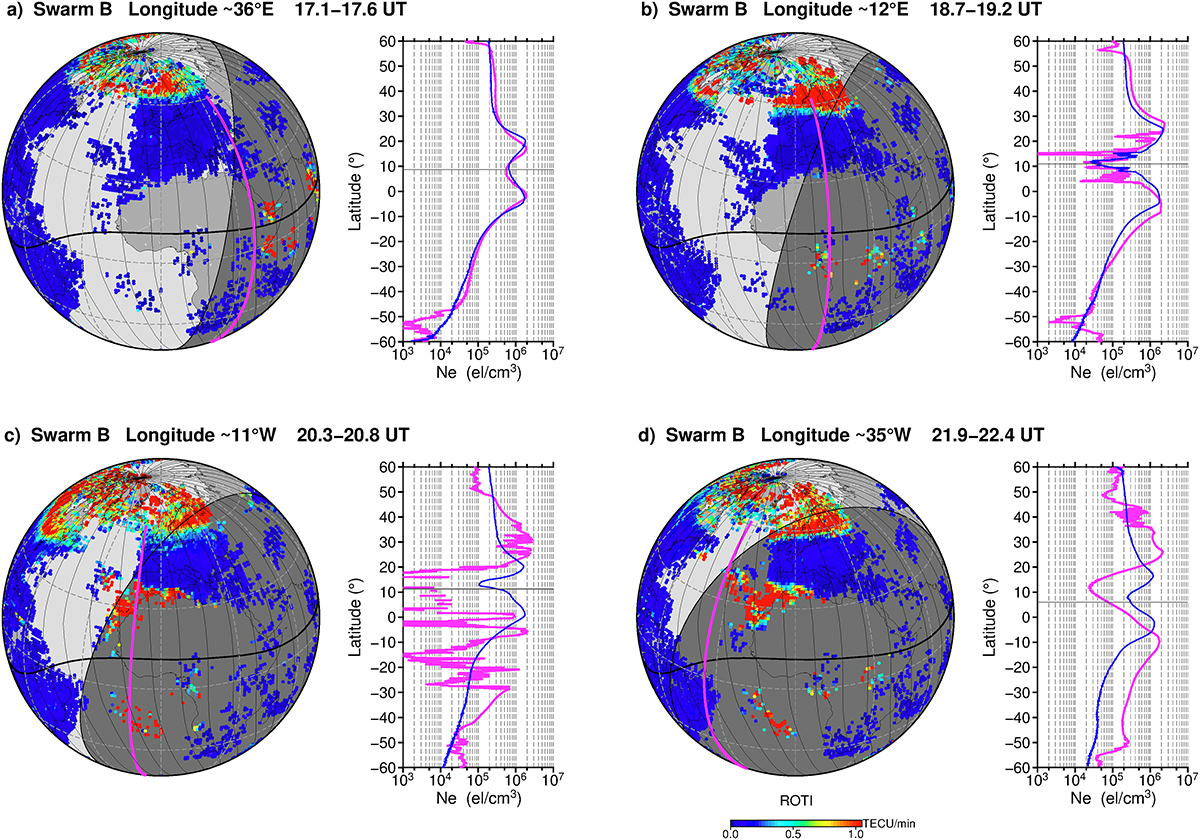
Figure 4

Download original image
(a)–(d) Sequence of several consecutive Swarm B satellite overpasses (magenta line) plotted over GNSS ROTI maps during 17–22 UT on 23 April 2023, along with Swarm in situ electron density (Ne) variations plotted as a function of geographical latitude for the storm day (magenta line) of 23 April 2023 and the reference day (blue line) of 22 April 2023. The thin horizontal line on density plots marks the magnetic equator location.
Current usage metrics show cumulative count of Article Views (full-text article views including HTML views, PDF and ePub downloads, according to the available data) and Abstracts Views on Vision4Press platform.
Data correspond to usage on the plateform after 2015. The current usage metrics is available 48-96 hours after online publication and is updated daily on week days.
Initial download of the metrics may take a while.


