Figure 3
Download original image
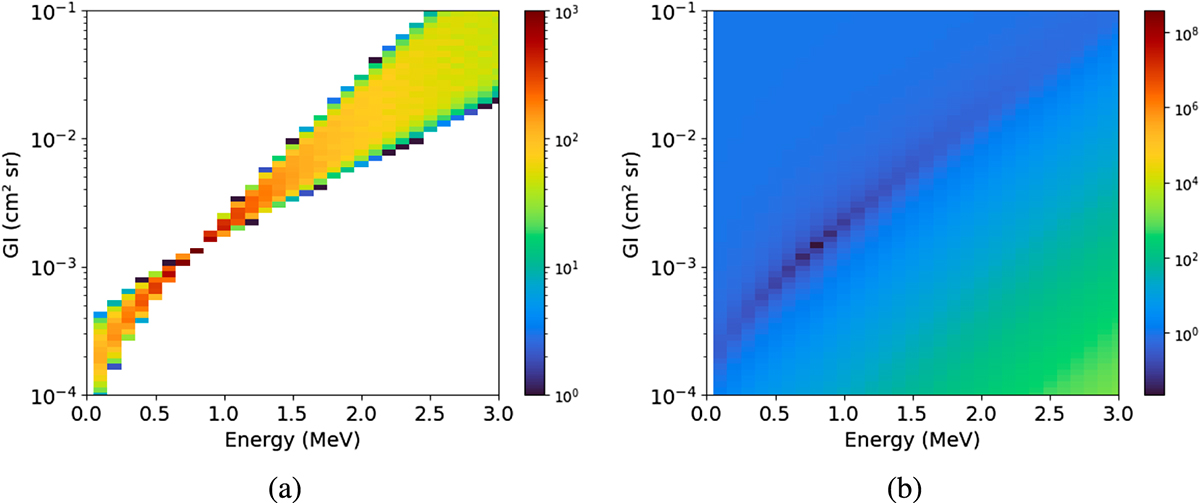
(a) Binned Bowtie representation of channel 10 of the PE2 detection head aboard HB13F using (4). The colorscale corresponds to the contribution of the database measurements used in relation to the grid’s (GI, ET) pairs. (b) Binned error map (based on the 75th of the error distribution) representation of channel 10 of the PE2 detection head aboard HB13F using (4). The color scale corresponds to the error evaluation.
Current usage metrics show cumulative count of Article Views (full-text article views including HTML views, PDF and ePub downloads, according to the available data) and Abstracts Views on Vision4Press platform.
Data correspond to usage on the plateform after 2015. The current usage metrics is available 48-96 hours after online publication and is updated daily on week days.
Initial download of the metrics may take a while.