Figure 4
Download original image
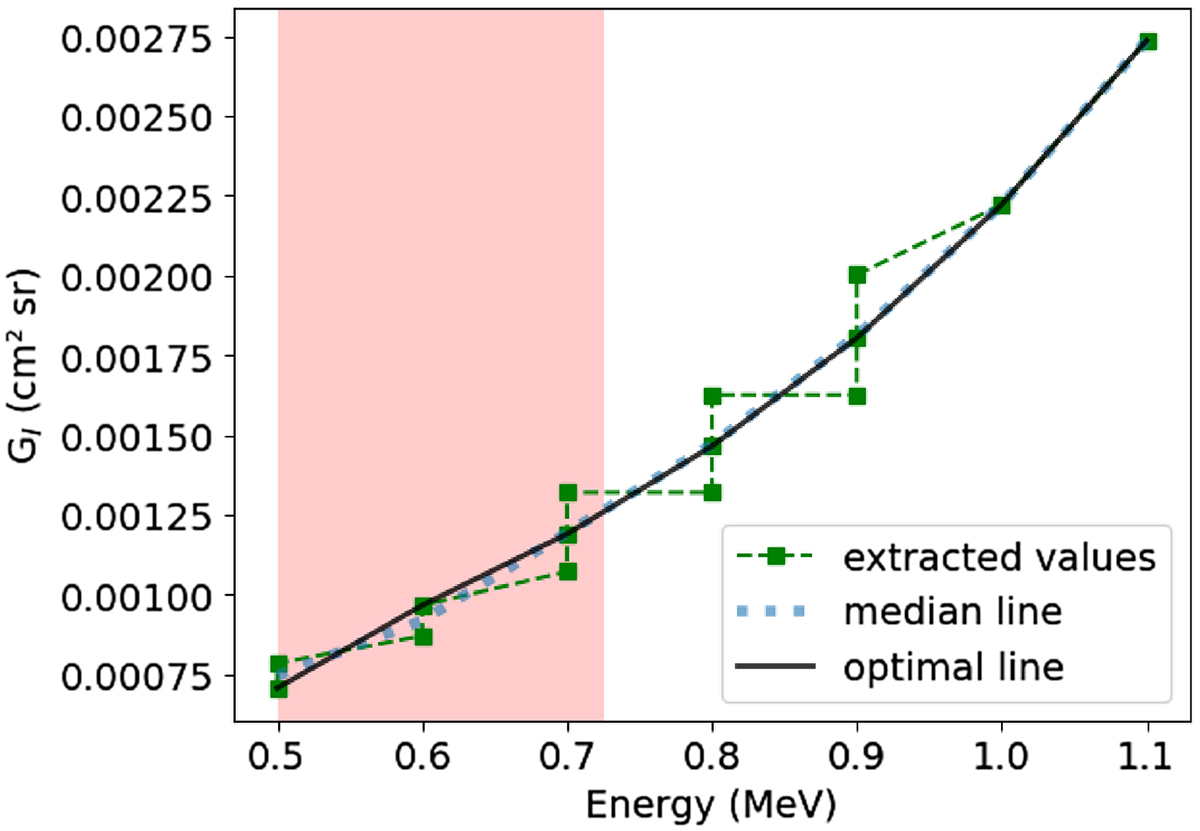
Conversion parameters extracted from the matrix shown in Figure 3b, combined with a 15% error tolerance. Green squares are directly extracted from the matrix, the blue dashed line corresponds to the median y-values and the black line corresponds to the optimal line (keeping only the minimal error for each energy). The red zone corresponds to non-physical sensitivity.
Current usage metrics show cumulative count of Article Views (full-text article views including HTML views, PDF and ePub downloads, according to the available data) and Abstracts Views on Vision4Press platform.
Data correspond to usage on the plateform after 2015. The current usage metrics is available 48-96 hours after online publication and is updated daily on week days.
Initial download of the metrics may take a while.