Figure 5
Download original image
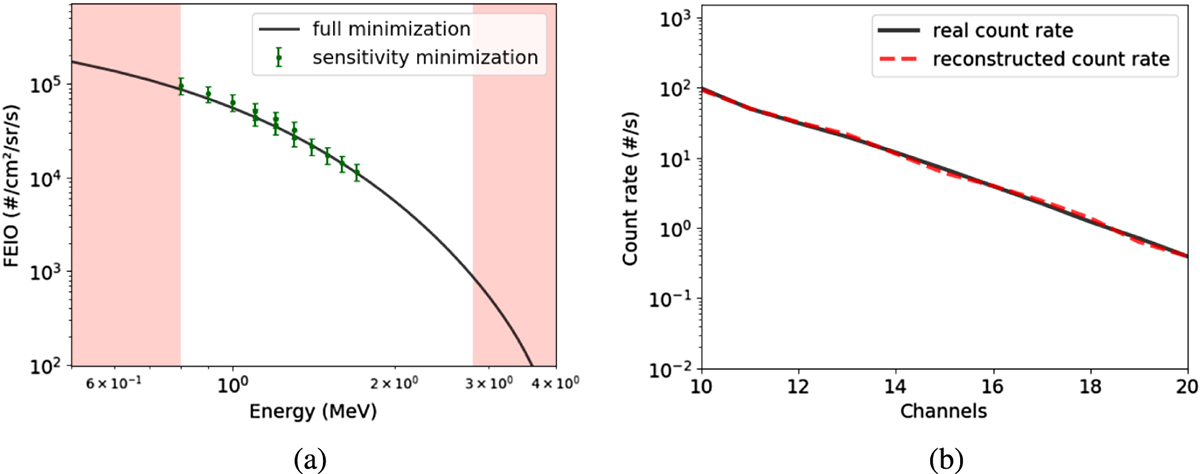
(a) Electron integral fluxes as a function of incident electron energy. Comparison of the two inversion methods described in the paper. The black curve corresponds to the full minimization method while the green dots with error bars correspond to the sensitivity analysis method. The calculated fluxes correspond to the day of 2023-04-01 observed by HotBird missions. In the case of inversion by sensitivity analysis, some energies are covered by different channels, which explains the overlap of some error bars. The red zones correspond to energies that have no influence, or very limited influence, on the instrument’s measurements. (b) Count rates observed (black full line) and reconstructed (red dashed line) during the same day.
Current usage metrics show cumulative count of Article Views (full-text article views including HTML views, PDF and ePub downloads, according to the available data) and Abstracts Views on Vision4Press platform.
Data correspond to usage on the plateform after 2015. The current usage metrics is available 48-96 hours after online publication and is updated daily on week days.
Initial download of the metrics may take a while.