Figure 7
Download original image
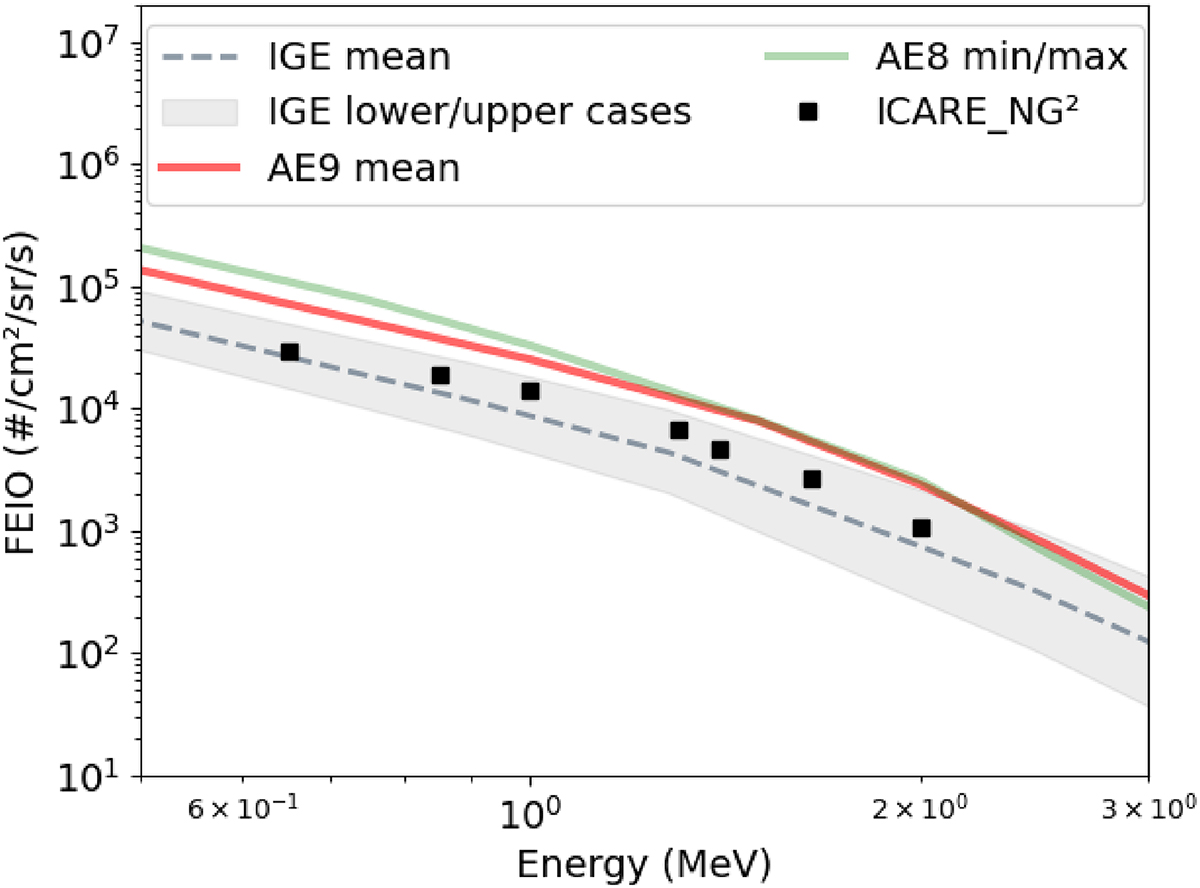
Comparisons of ICARE_NG2 measurements with several specification models: green full line, red full line, and gray dashed line for AE9 mean, AE8 and IGE models respectively. In GEO, AE8 provides the same results at both minimum and maximum solar activity. Lower and upper cases for IGE model are also indicated by the gray area.
Current usage metrics show cumulative count of Article Views (full-text article views including HTML views, PDF and ePub downloads, according to the available data) and Abstracts Views on Vision4Press platform.
Data correspond to usage on the plateform after 2015. The current usage metrics is available 48-96 hours after online publication and is updated daily on week days.
Initial download of the metrics may take a while.