Figure 8

Download original image
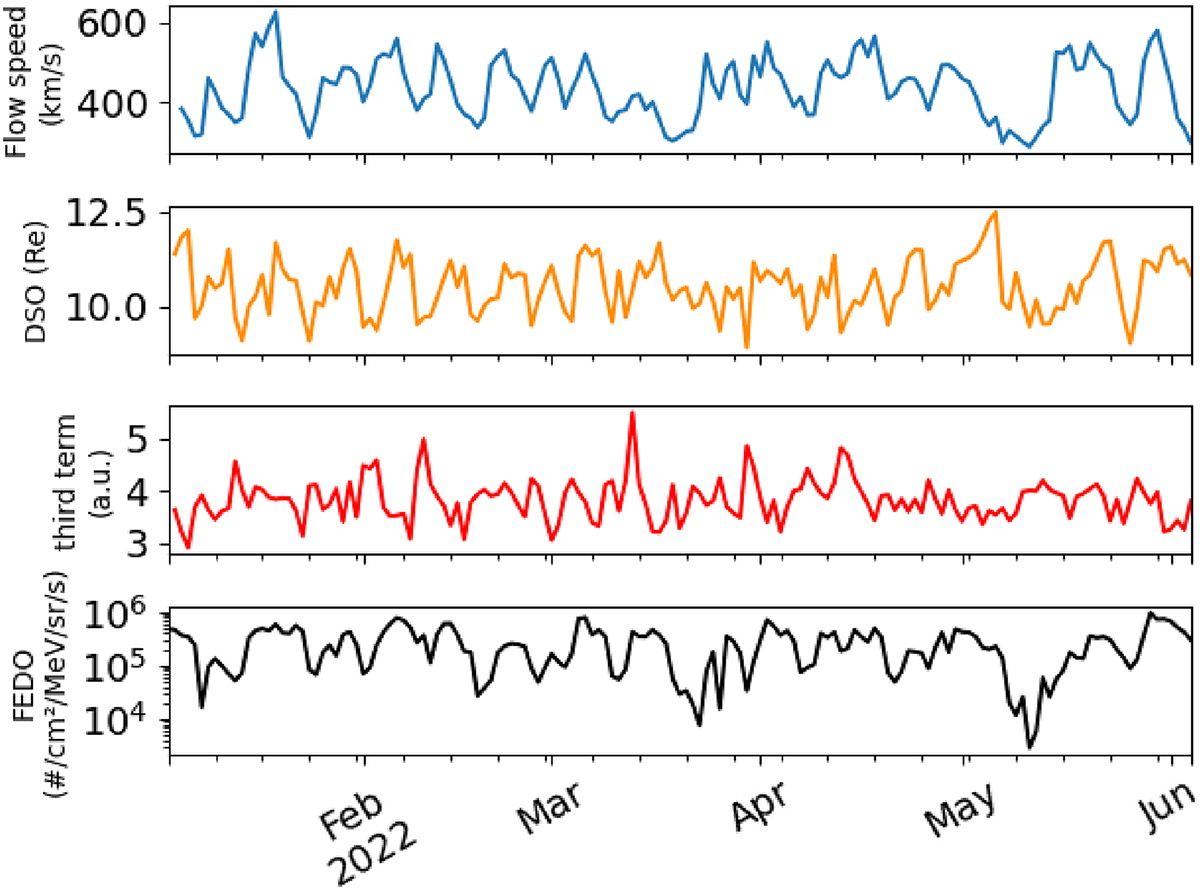
Solar wind data used in the proposed model. The first plot corresponds to the solar wind speed, the second one corresponds to the magnetopause location using the Shue model, the third one corresponds to the last term of g(t) and the last plot is the observations of 600 keV electrons provided by EDRS-C/NGRM. The first half of 2022 is presented.
Current usage metrics show cumulative count of Article Views (full-text article views including HTML views, PDF and ePub downloads, according to the available data) and Abstracts Views on Vision4Press platform.
Data correspond to usage on the plateform after 2015. The current usage metrics is available 48-96 hours after online publication and is updated daily on week days.
Initial download of the metrics may take a while.


