Figure 2
Download original image
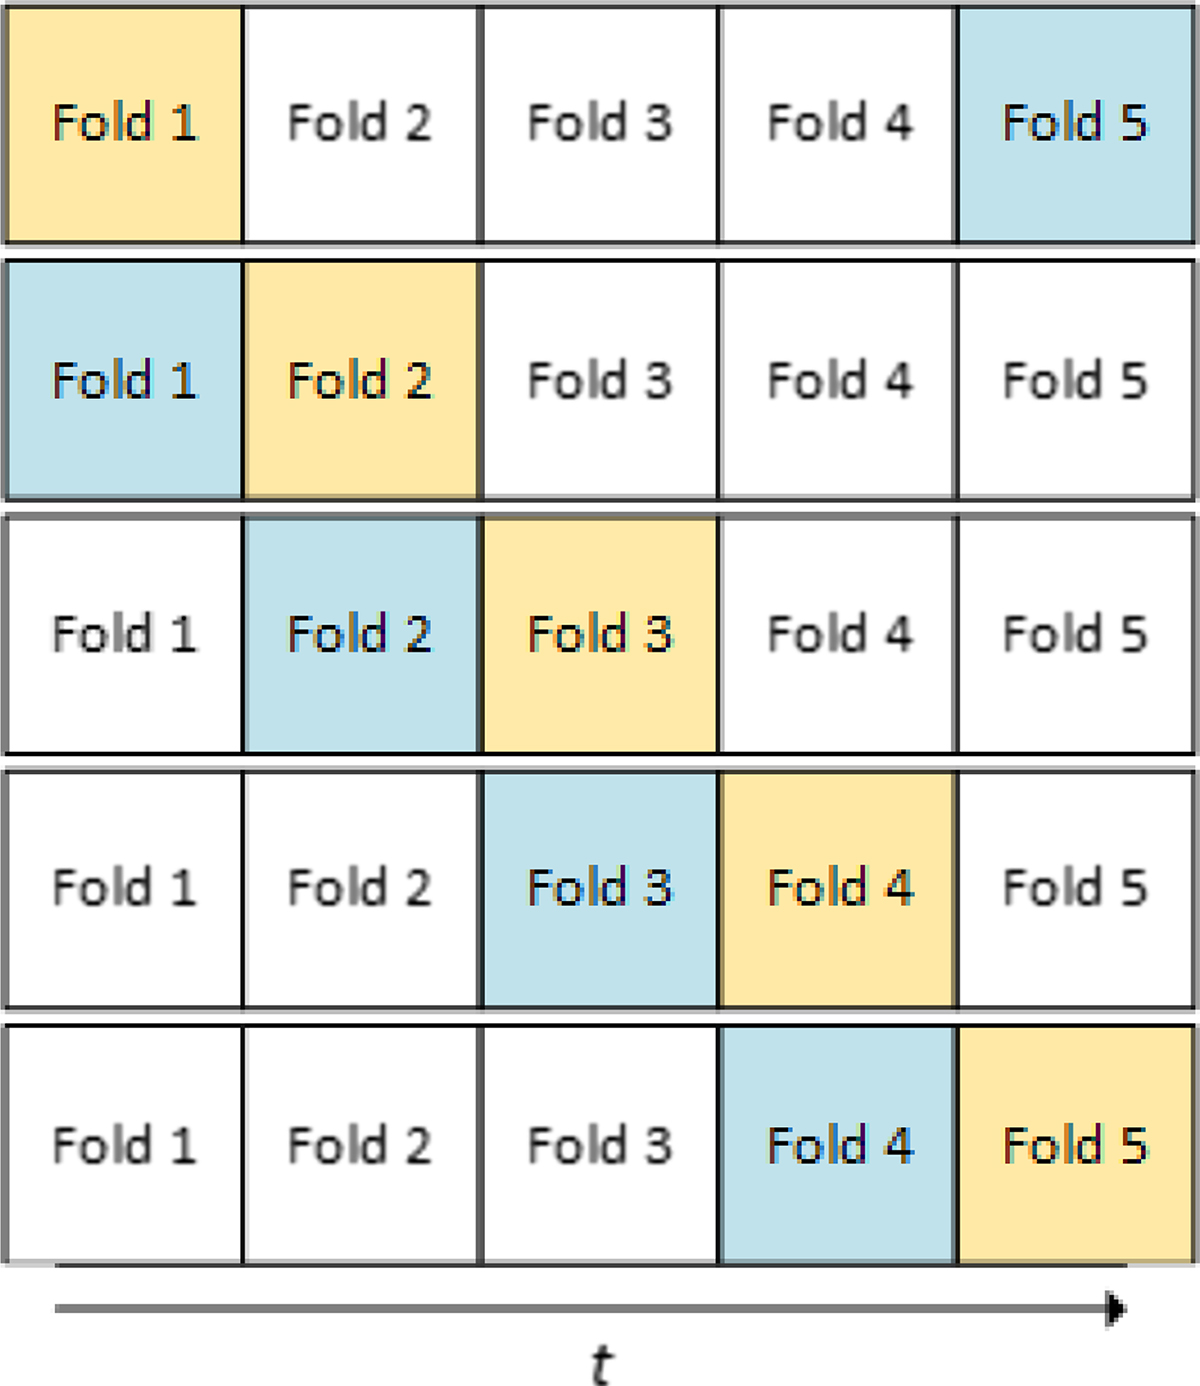
Schematic representation of the 5-fold cross-validation procedure. The time series is split into sequential folds to preserve causality. For each step of the experiment, the fold marked in orange is used as the test set, and the fold marked in blue is used as the validation set. The remainder of the data is used for training.
Current usage metrics show cumulative count of Article Views (full-text article views including HTML views, PDF and ePub downloads, according to the available data) and Abstracts Views on Vision4Press platform.
Data correspond to usage on the plateform after 2015. The current usage metrics is available 48-96 hours after online publication and is updated daily on week days.
Initial download of the metrics may take a while.