Figure 1
Download original image
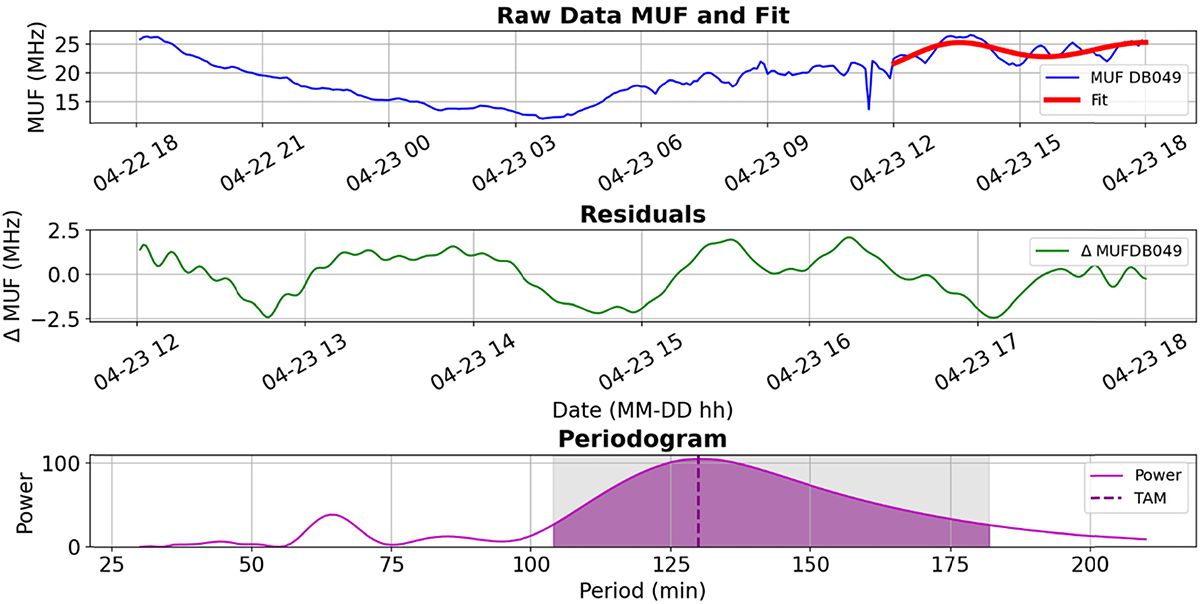
On the top panel, MUF (MUF(3000)F2) data series from the 24 previous hours, from April 22 at 1800UT to April 23 at 1800UT. The red curve corresponds to the fit applied to remove the main daily trends for the last 6 hours, from April 23 at 1200UT to April 23 at 1800UT. The second panel shows the residuals, ΔMUF, for the last 6 h, the difference between the original data series and the fit. The third panel shows the periodogram of the last 6 h, with a dominant period around 130 min. Painted in magenta, the area defined by 0.8 TAM and 1.4 TAM, where TAM is the maximum amplitude period, in this case around 130 min. The final value of SEC is obtained from the ratio between the area painted and the total area under the curve.
Current usage metrics show cumulative count of Article Views (full-text article views including HTML views, PDF and ePub downloads, according to the available data) and Abstracts Views on Vision4Press platform.
Data correspond to usage on the plateform after 2015. The current usage metrics is available 48-96 hours after online publication and is updated daily on week days.
Initial download of the metrics may take a while.