Figure 2
Download original image
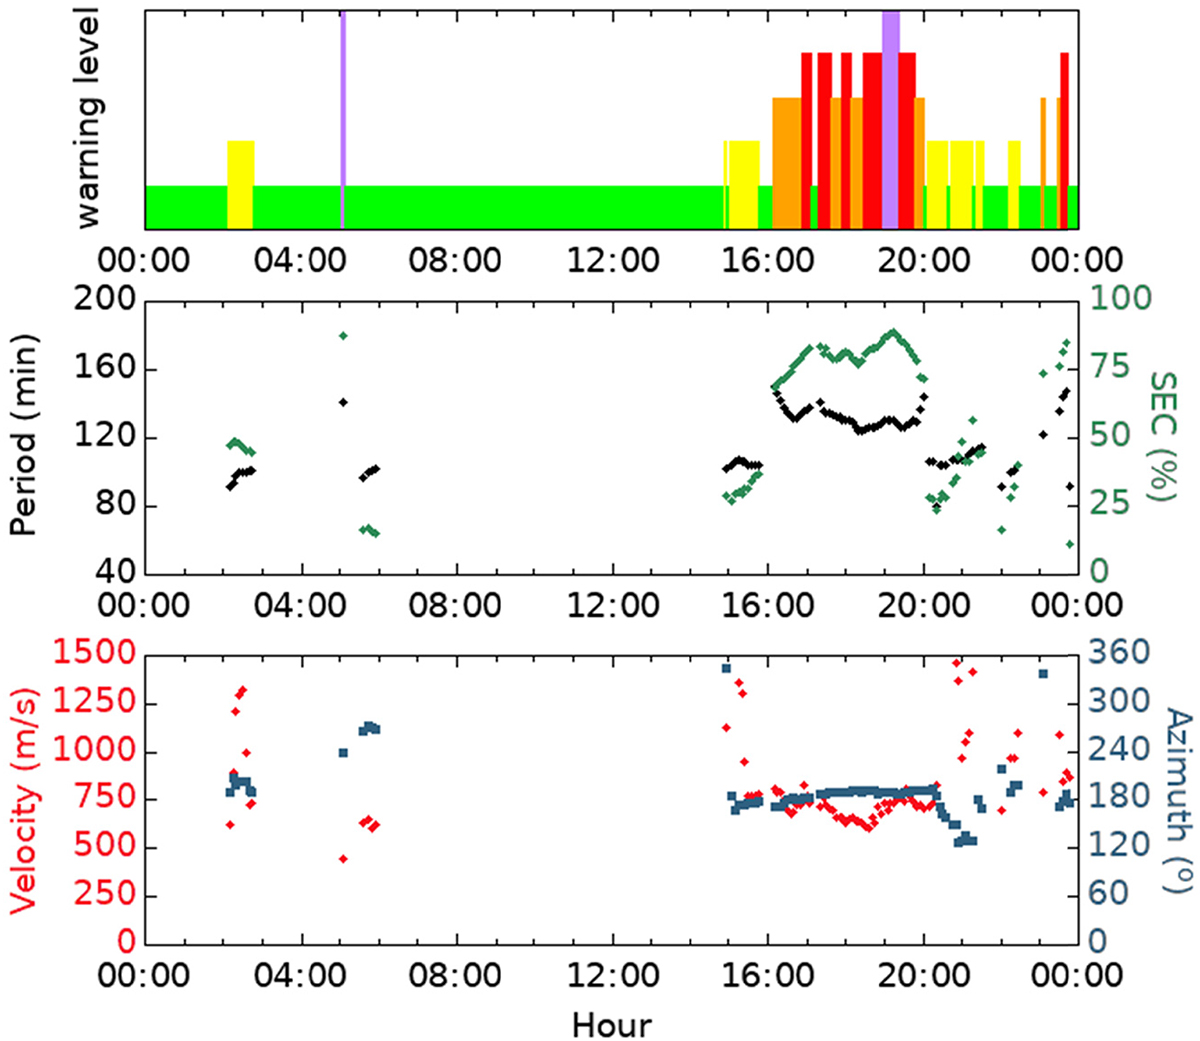
Time variations of the characteristics of the LSTID detected by the HF-INT at Dourbes, Belgium, for April 23, 2023. The top plot depicts the activity levels of LSTIDs (green, yellow, orange, red, and magenta for Insignificant, Weak, Moderate, Strong, and Very Strong activity, respectively). The middle plot depicts the dominant period (black diamonds) and SEC (green diamonds), and bottom plots depict the magnitude of the velocity (red diamonds) and azimuth direction (blue squares) of propagation of the detected LSTID.
Current usage metrics show cumulative count of Article Views (full-text article views including HTML views, PDF and ePub downloads, according to the available data) and Abstracts Views on Vision4Press platform.
Data correspond to usage on the plateform after 2015. The current usage metrics is available 48-96 hours after online publication and is updated daily on week days.
Initial download of the metrics may take a while.