Open Access
Figure 4
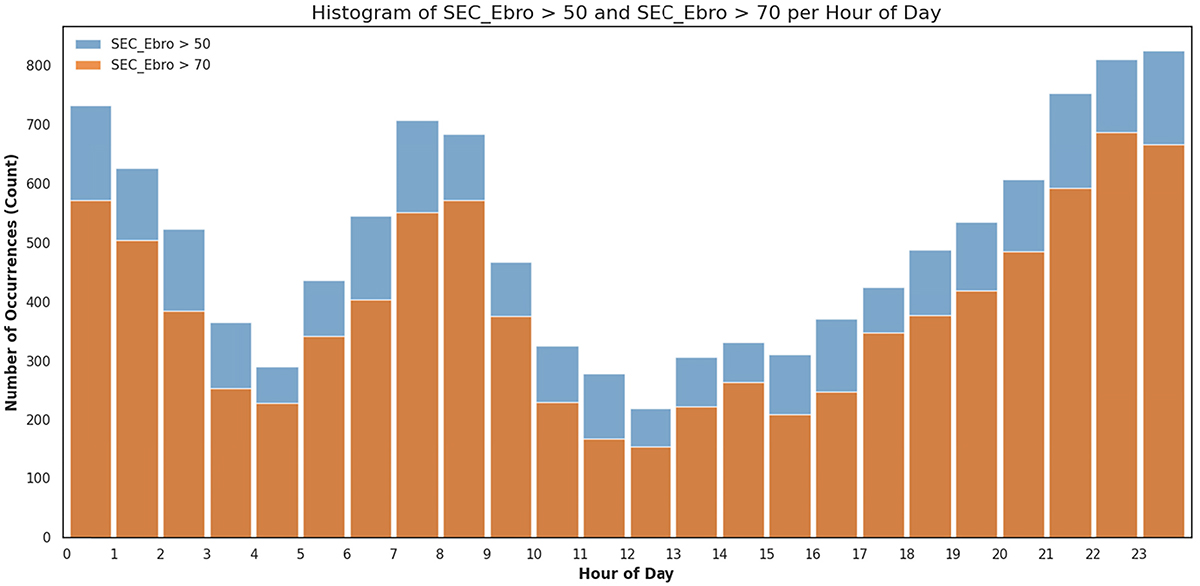
Download original image
Distribution of the occurrence of the SEC over the hours of the day (in UT) for Ebro Digisonde station data (January 1, 2022–June 30, 2023), illustrating the counts where SEC_Ebro > 50% (marked with blue) and the counts where SEC_Ebro>70% (orange). In this plot, “no data” values are disregarded.
Current usage metrics show cumulative count of Article Views (full-text article views including HTML views, PDF and ePub downloads, according to the available data) and Abstracts Views on Vision4Press platform.
Data correspond to usage on the plateform after 2015. The current usage metrics is available 48-96 hours after online publication and is updated daily on week days.
Initial download of the metrics may take a while.