Figure 8
Download original image
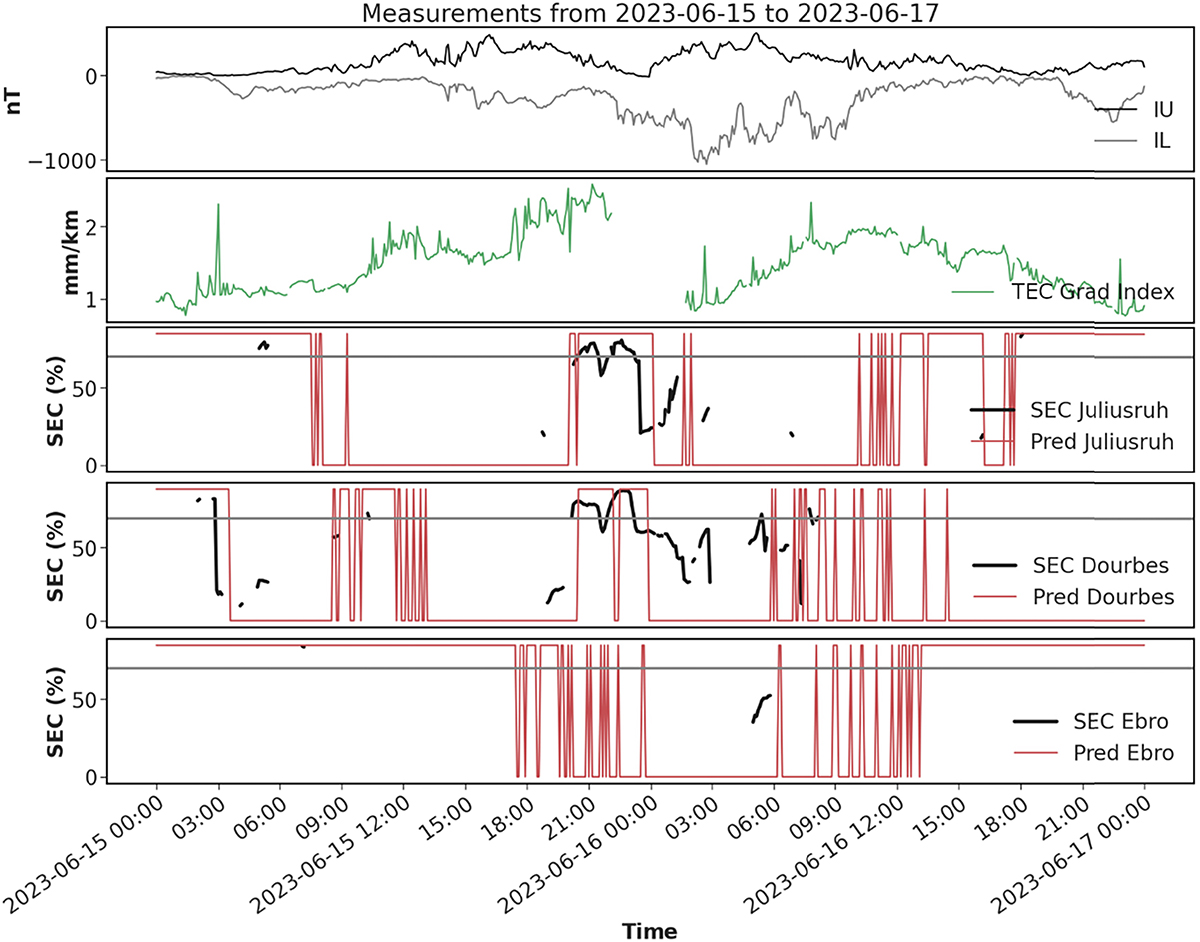
TFT classifier results obtained for an ionospheric storm that occurred within the test period. The forecasted SEC and the calculated SEC are overplotted at three Digisonde locations, in Juliusruh, Dourbes, and Ebro. Grey horizontal lines in the last three panels correspond to theta = 70%. Predictions are generated with a 40-min forecast horizon.
Current usage metrics show cumulative count of Article Views (full-text article views including HTML views, PDF and ePub downloads, according to the available data) and Abstracts Views on Vision4Press platform.
Data correspond to usage on the plateform after 2015. The current usage metrics is available 48-96 hours after online publication and is updated daily on week days.
Initial download of the metrics may take a while.