Figure 3
Download original image
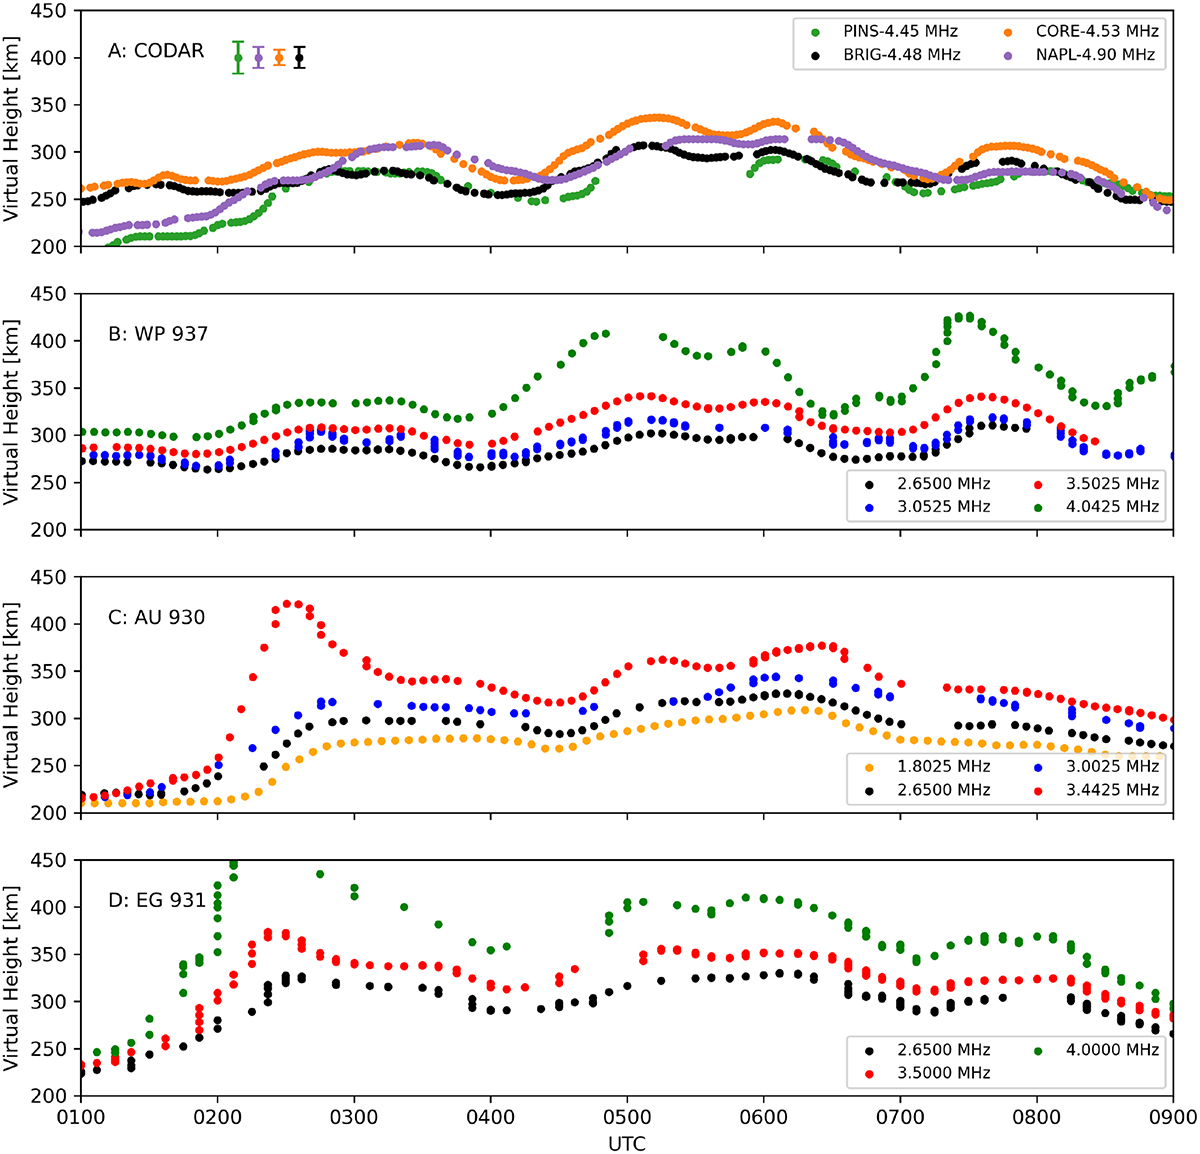
A time series of virtual height oscillations from October 06, 2020. Panel A shows the four CODAR stations: BRIG, CORE, NAPL, and PINS color coded by transmission frequency. Panel B is the Digisonde station WP 937, located in Virginia. Panel C is the Digisonde station AU 930, located in Texas, and Panel D is the Digisonde station EG 931, located in Florida. All virtual height traces shown in each panel are for O-mode propagation only.
Current usage metrics show cumulative count of Article Views (full-text article views including HTML views, PDF and ePub downloads, according to the available data) and Abstracts Views on Vision4Press platform.
Data correspond to usage on the plateform after 2015. The current usage metrics is available 48-96 hours after online publication and is updated daily on week days.
Initial download of the metrics may take a while.