Figure 1
Download original image
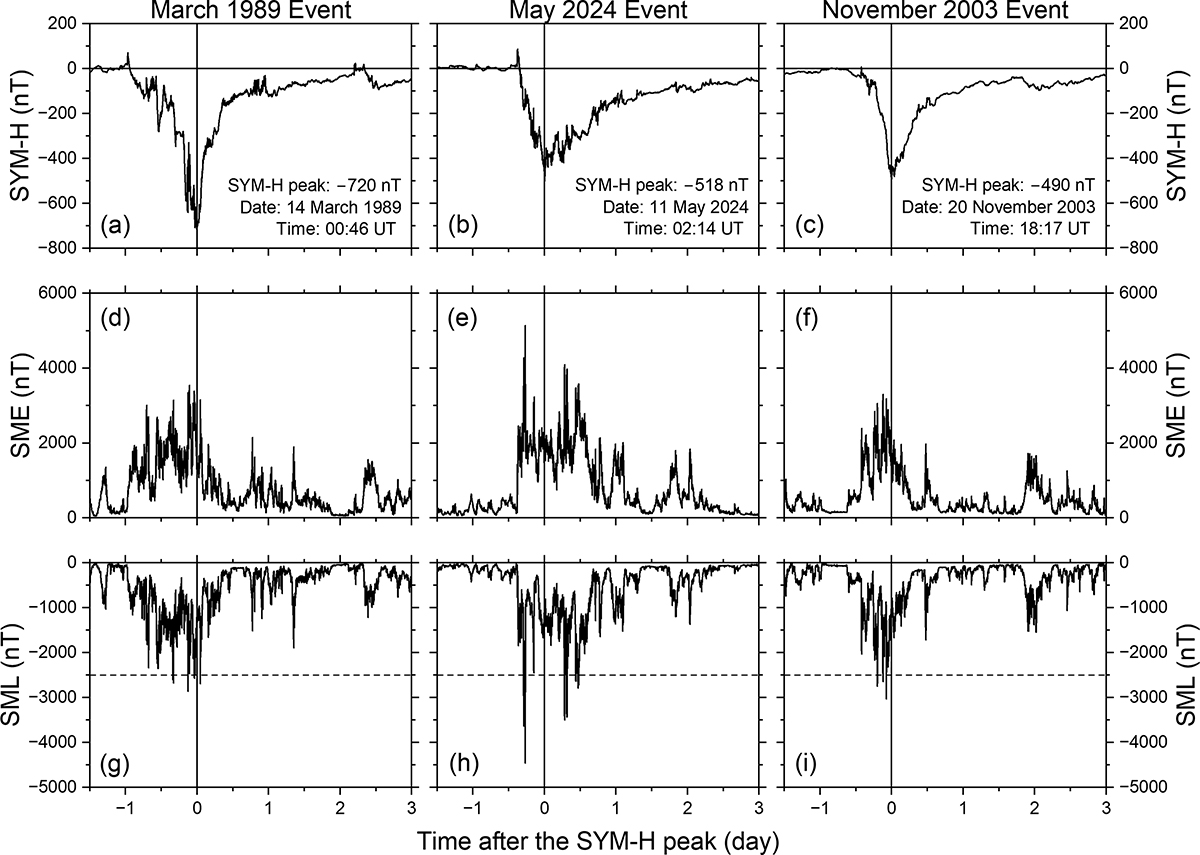
Three largest geomagnetic superstorms by SYM-H index (since 1981). From top to bottom, panels are (a–c) geomagnetic symmetric ring current index SYM-H, (d–f) auroral electrojet index SME, and (g–i) westward auroral electrojet index SML for the March 1989 storm (left panels), the May 2024 storm (middle panels), and the November 2003 storm (right panels). The x-axis indicates times in units of days after the onset of the SYM-H peaks mentioned in the top panels. Horizontal dashed lines in the bottom panels indicate the SML = −2500 nT level, the threshold for an SSS (Tsurutani et al., 2015).
Current usage metrics show cumulative count of Article Views (full-text article views including HTML views, PDF and ePub downloads, according to the available data) and Abstracts Views on Vision4Press platform.
Data correspond to usage on the plateform after 2015. The current usage metrics is available 48-96 hours after online publication and is updated daily on week days.
Initial download of the metrics may take a while.