Figure 3
Download original image
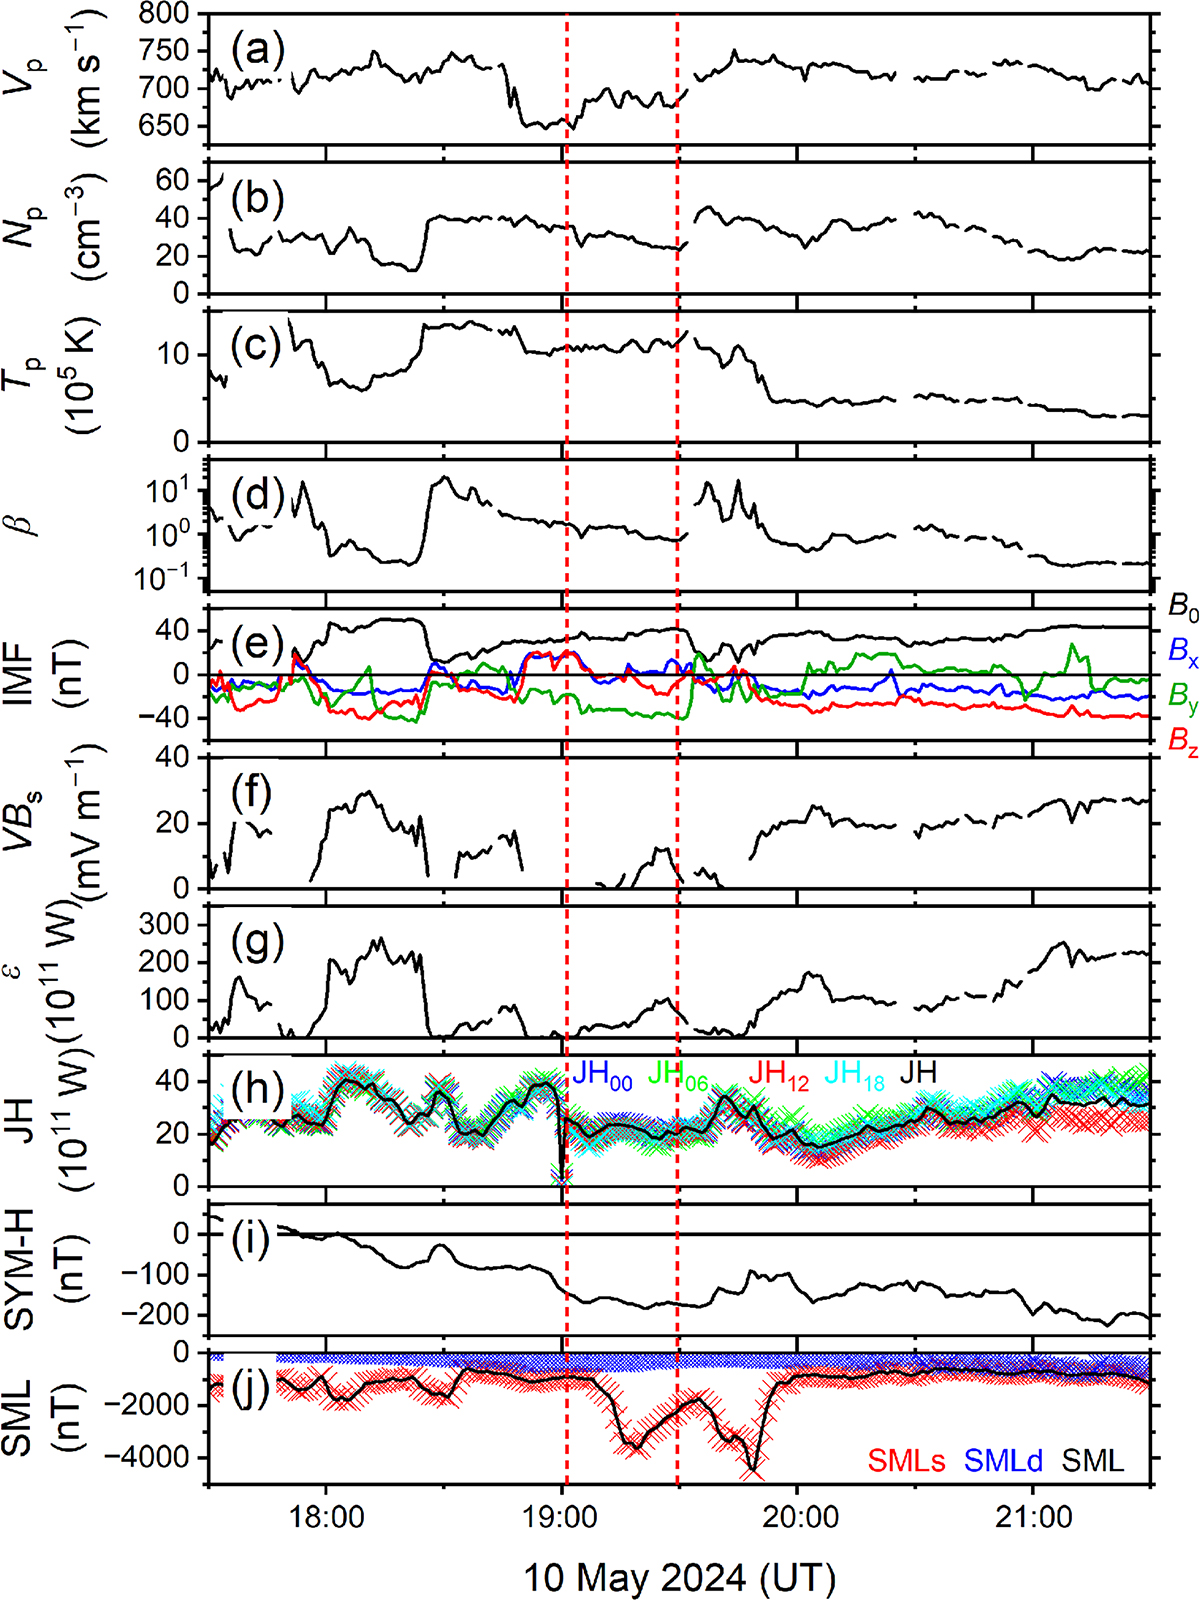
Interplanetary conditions and energy coupling associated with SSS 1 and SSS 2 during 10 May 2024 between 19:00 and 20:00 UT. From top to bottom, the panels are: (a) Vp, (b) Np, (c) Tp, (d) β, (e) IMF B0, Bx, By, and Bz, (f) VBs, (g) the solar wind energy input rate/Akasofu ε-parameter; (h) the total JH rate (black), and the JH rates during 6-h long MLT sectors centered at 00:00 MLT (blue), 06:00 MLT (green), 12:00 MLT (red), and 18:00 MLT (cyan); (i) SYM-H, and (j) total SML (black), the sunlit ionospheric SML (SMLs, red), and the darkside SML (SMLd, blue). Vertical short-dashed red lines indicate the onset times of SSS 1 and SSS 2 expansion phases.
Current usage metrics show cumulative count of Article Views (full-text article views including HTML views, PDF and ePub downloads, according to the available data) and Abstracts Views on Vision4Press platform.
Data correspond to usage on the plateform after 2015. The current usage metrics is available 48-96 hours after online publication and is updated daily on week days.
Initial download of the metrics may take a while.