Figure 6
Download original image
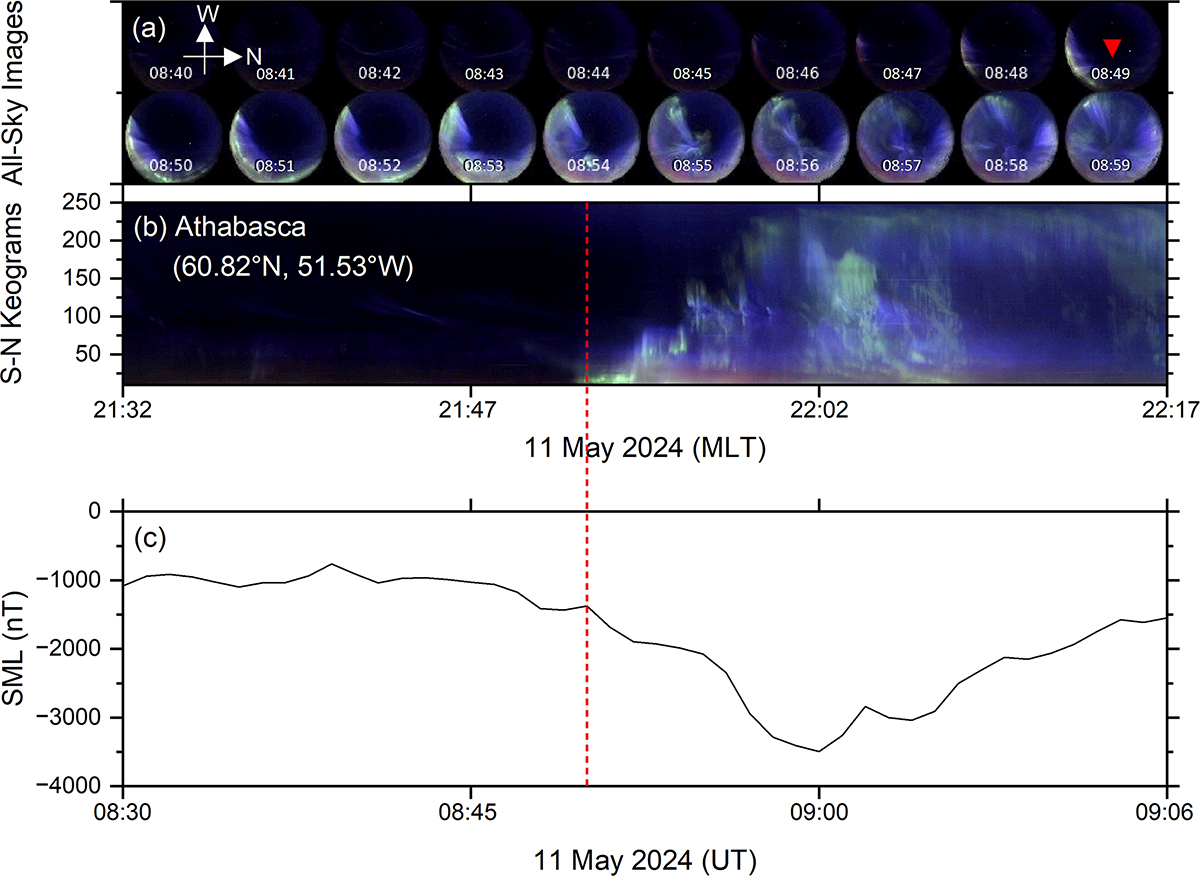
All-sky images (ASIs) at Athabasca, Canada, during SSS 3 on 11 May 2024. (a) ASI montages at every minute from 08:40 to 08:59 UT, directions are shown by arrows, UTs are mentioned for each of the ASIs; (b) ASI S-N keograms, Athabasca MLT is shown in the x-axis; and (c) SML variation. The substorm onset determined by the sharp SML decrease is marked by a vertical red short-dashed line, and the corresponding ASI is marked by a red downward arrow.
Current usage metrics show cumulative count of Article Views (full-text article views including HTML views, PDF and ePub downloads, according to the available data) and Abstracts Views on Vision4Press platform.
Data correspond to usage on the plateform after 2015. The current usage metrics is available 48-96 hours after online publication and is updated daily on week days.
Initial download of the metrics may take a while.