Open Access
Figure 4
Download original image
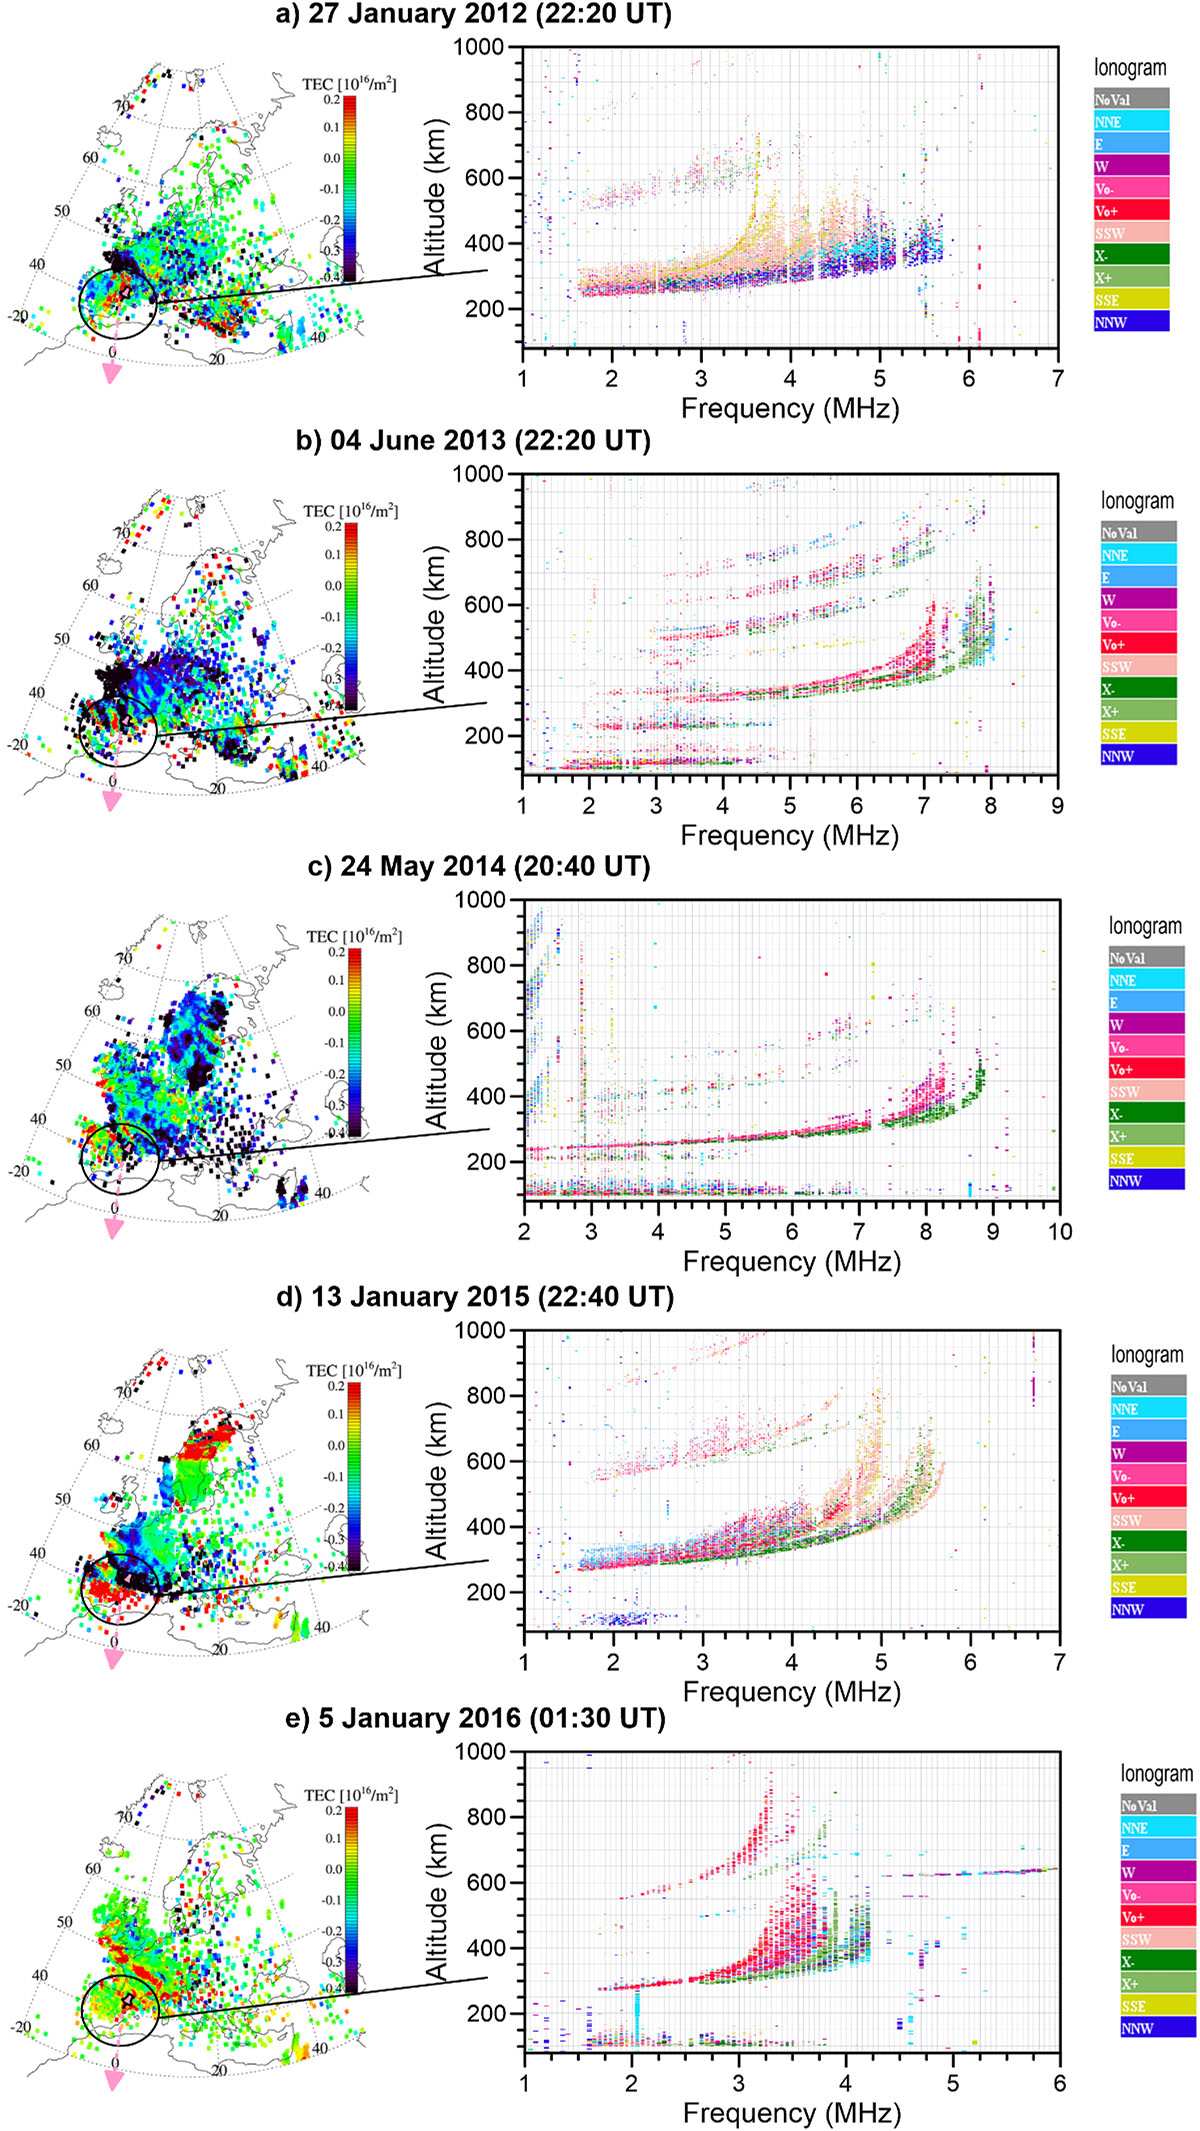
Examples of d-TEC maps (left plots) indicating signatures of MSTIDs jointly with ionograms recorded at Roquetes (right plots), simultaneous with MSTID activity at indicated timestamps. The pink location marker in the d-TEC maps indicates the position of the EB040 station. See text for details.
Current usage metrics show cumulative count of Article Views (full-text article views including HTML views, PDF and ePub downloads, according to the available data) and Abstracts Views on Vision4Press platform.
Data correspond to usage on the plateform after 2015. The current usage metrics is available 48-96 hours after online publication and is updated daily on week days.
Initial download of the metrics may take a while.