Open Access
Figure 6
Download original image
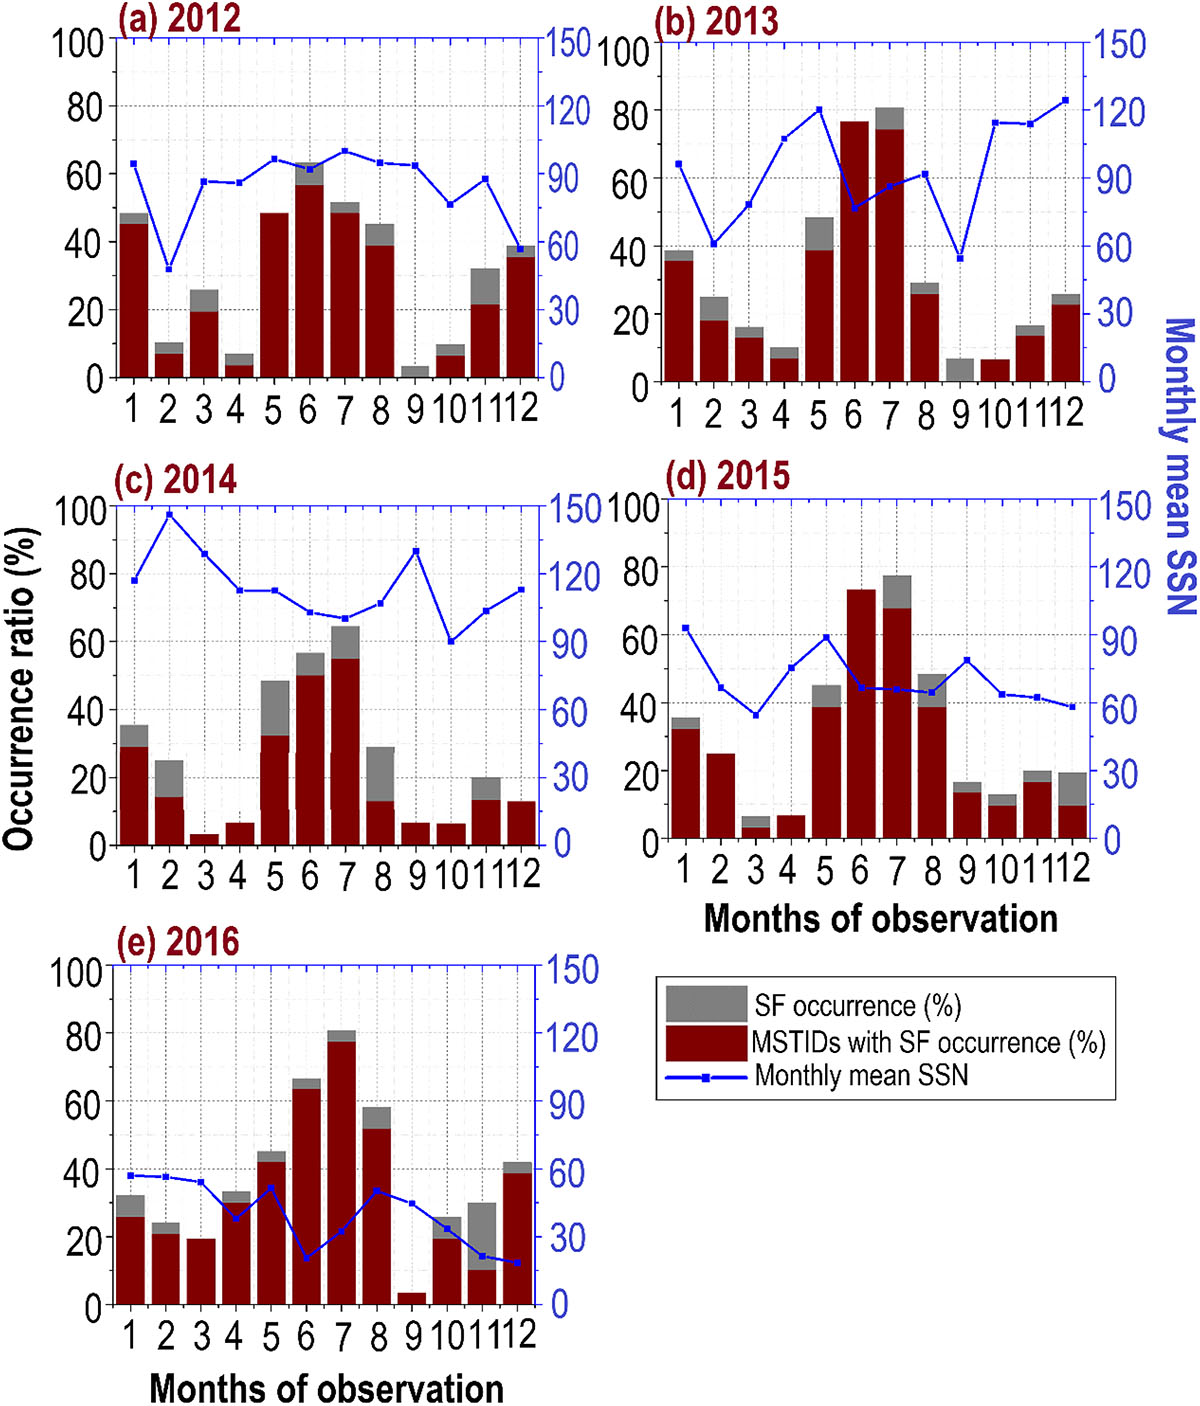
Seasonal variation of SF occurrence and associated MSTID activity for the years 2012–2022. Histograms depict the monthly occurrence rates (1–12: January–December) for both SF and MSTIDs. The blue dotted line shows solar activity (right y-axis).
Current usage metrics show cumulative count of Article Views (full-text article views including HTML views, PDF and ePub downloads, according to the available data) and Abstracts Views on Vision4Press platform.
Data correspond to usage on the plateform after 2015. The current usage metrics is available 48-96 hours after online publication and is updated daily on week days.
Initial download of the metrics may take a while.