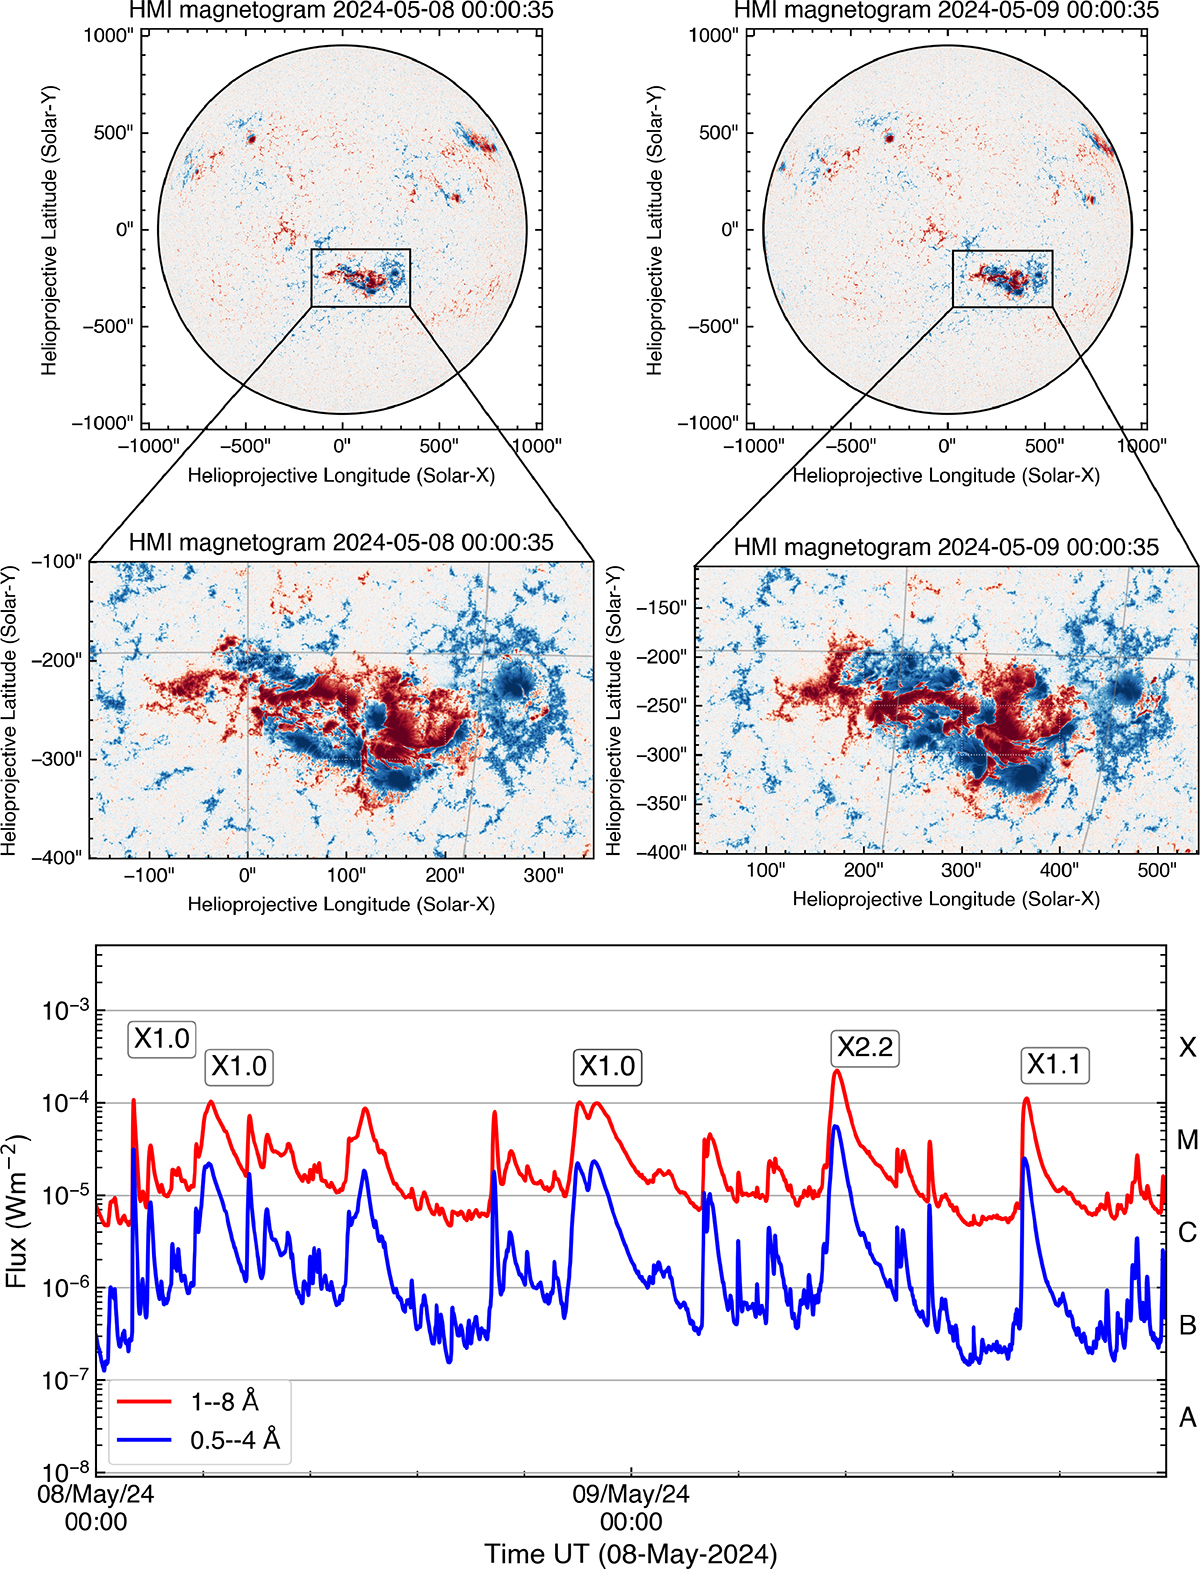
Figure 1
Download original image
Top: SDO/HMI magnetogram of NOAA AR 13664 on 8 and 9 May 2024, with zoomed-in panels over the AR. Bottom: Time series of GOES X-ray flux (8–9 May 2024 inclusive) showing the sequence of flares from the same region. These flares were associated with multiple CMEs that drove the geomagnetic storm beginning on 10 May.
Current usage metrics show cumulative count of Article Views (full-text article views including HTML views, PDF and ePub downloads, according to the available data) and Abstracts Views on Vision4Press platform.
Data correspond to usage on the plateform after 2015. The current usage metrics is available 48-96 hours after online publication and is updated daily on week days.
Initial download of the metrics may take a while.