Figure 10
Download original image
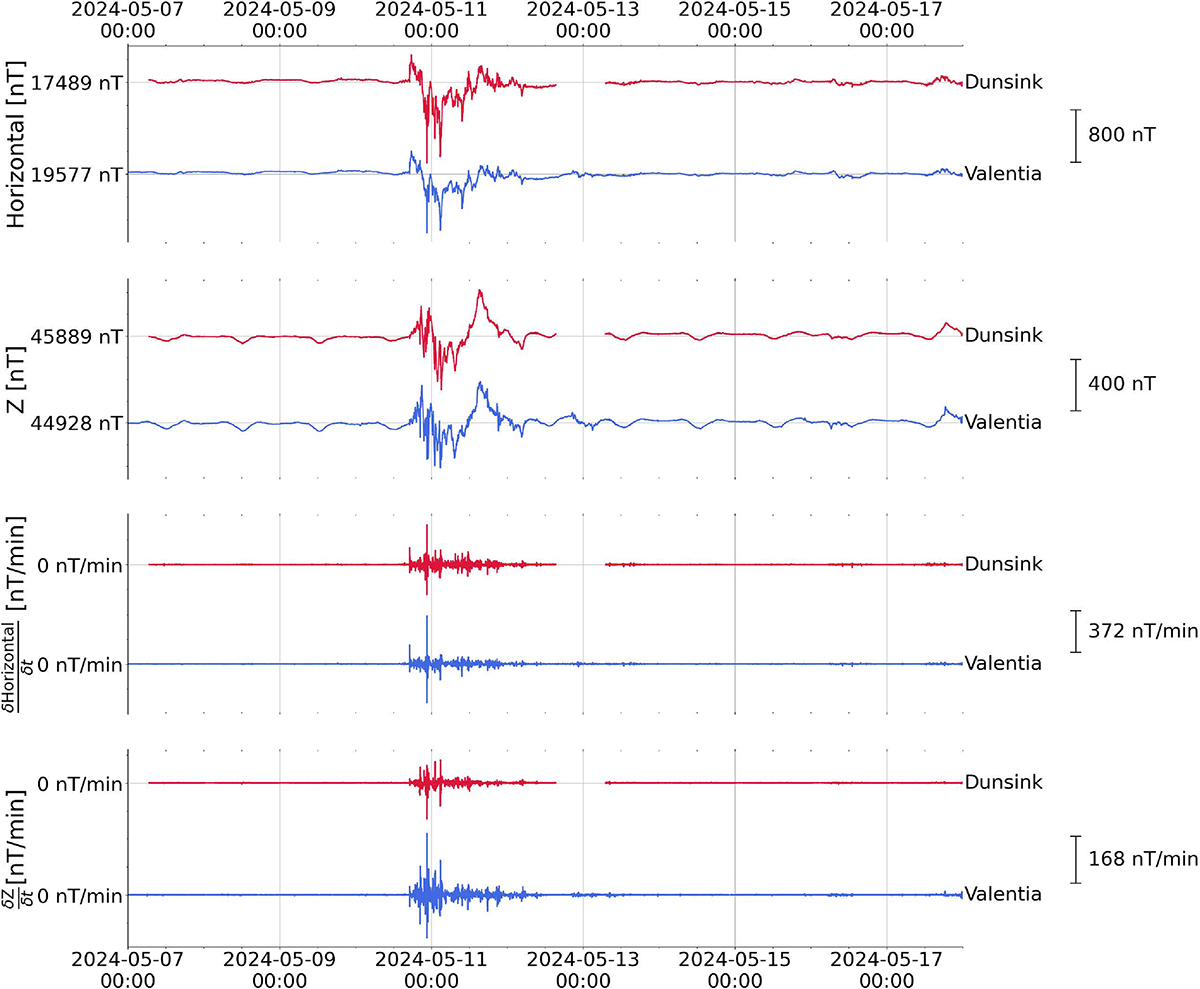
MagIE Magnetometer Stack Plot for the 5th to the 17th of May 2024 inclusive. The magnetic field components in red and blue are recorded by Dunsink and Valentia, respectively; top to bottom: horizontal/H, down/Z component, followed by the time derivative of H and Z. Ticks on the left show the Huber mean of each parameter for the plotted period and the scale of each panel is shown by whiskers on the right.
Current usage metrics show cumulative count of Article Views (full-text article views including HTML views, PDF and ePub downloads, according to the available data) and Abstracts Views on Vision4Press platform.
Data correspond to usage on the plateform after 2015. The current usage metrics is available 48-96 hours after online publication and is updated daily on week days.
Initial download of the metrics may take a while.