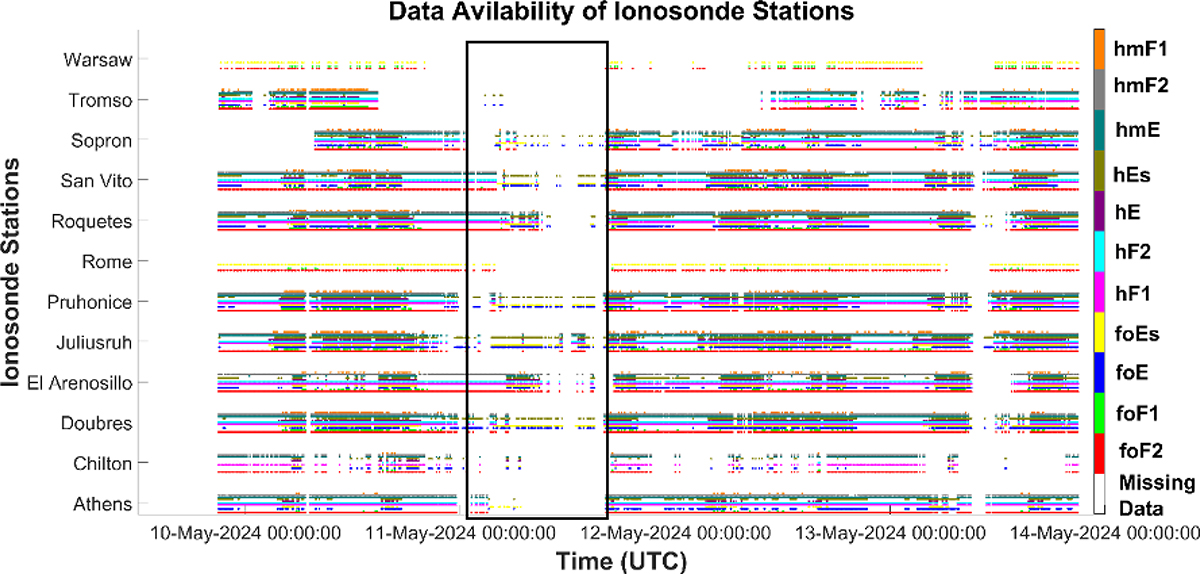
Figure A1.
Download original image
Data availability for multiple European ionosonde stations from 9 May to 14 May 2024, with each coloured bar representing a specific ionospheric parameter (e.g., foF2, foF1, etc.) measured at a given station over the set time.The black rectangle highlights the morning of 11 May, when the European ionosonde network experienced an “information blackout”.
Current usage metrics show cumulative count of Article Views (full-text article views including HTML views, PDF and ePub downloads, according to the available data) and Abstracts Views on Vision4Press platform.
Data correspond to usage on the plateform after 2015. The current usage metrics is available 48-96 hours after online publication and is updated daily on week days.
Initial download of the metrics may take a while.