Figure C1.
Download original image
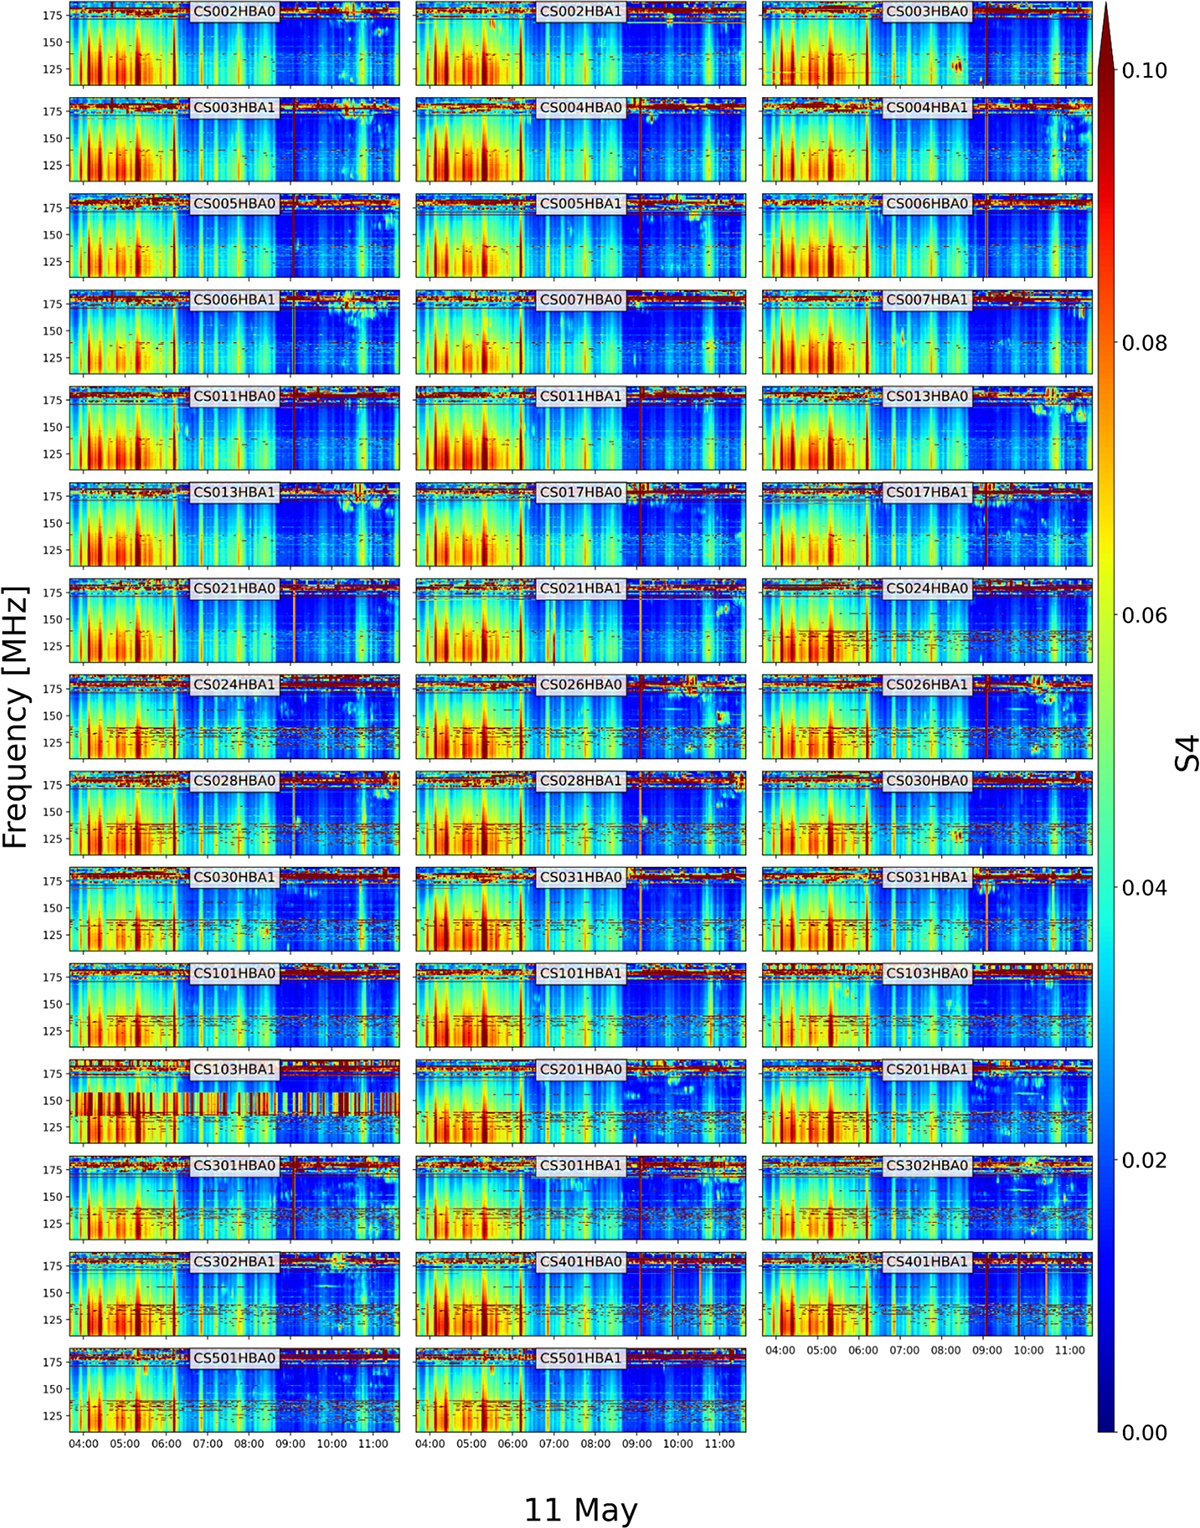
LOFAR data for observation L2040001, covering the period of May 11th from 3:40 until 11:40 UTC. The astronomical source of the signal is Cassiopeia A. The plot represents the S4 indexes, measured at 180s, of all the HBA Core antennas.
Current usage metrics show cumulative count of Article Views (full-text article views including HTML views, PDF and ePub downloads, according to the available data) and Abstracts Views on Vision4Press platform.
Data correspond to usage on the plateform after 2015. The current usage metrics is available 48-96 hours after online publication and is updated daily on week days.
Initial download of the metrics may take a while.