Figure 2
Download original image
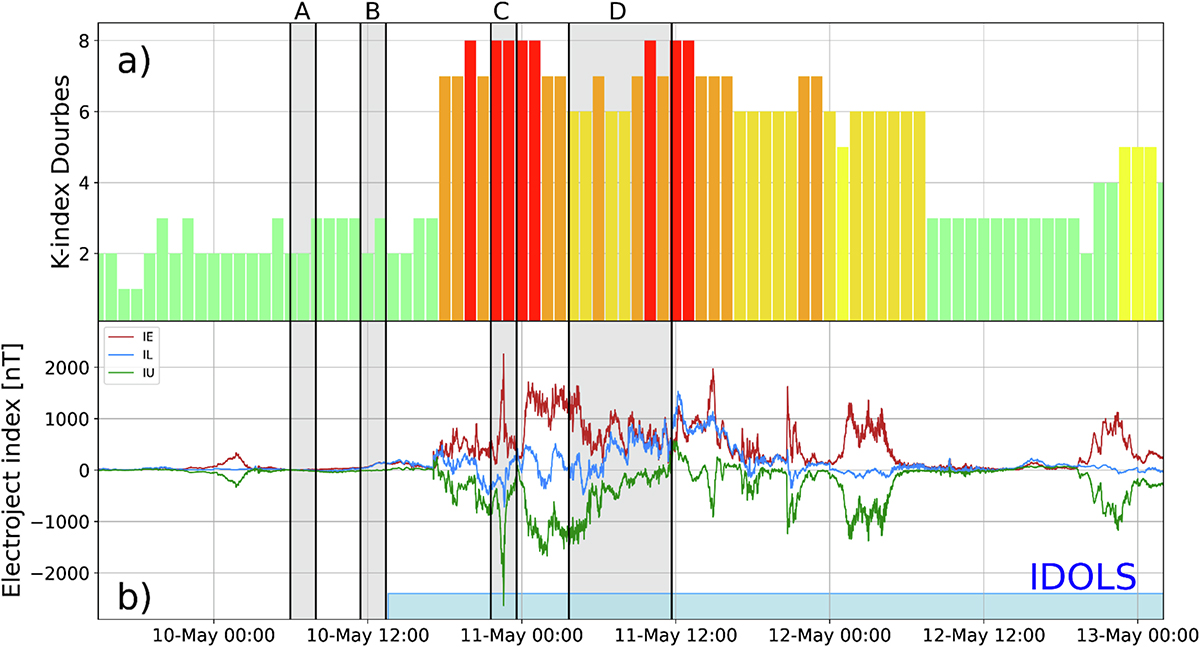
Panel a) shows the K-index from Dourbes from 15:00 UT on May 9th until 02:00 UT on May 14th. The color of the bars indicates the NOAA Space Weather Scale for geomagnetic storms4. Panel b) shows the electrojet indicators IE, IL, and IU for IMAGE magnetometers. The grey bars represent the five all-stations LOFAR observations, while the blue one represent the period of available IDOLS data.
Current usage metrics show cumulative count of Article Views (full-text article views including HTML views, PDF and ePub downloads, according to the available data) and Abstracts Views on Vision4Press platform.
Data correspond to usage on the plateform after 2015. The current usage metrics is available 48-96 hours after online publication and is updated daily on week days.
Initial download of the metrics may take a while.