Figure E1.
Download original image
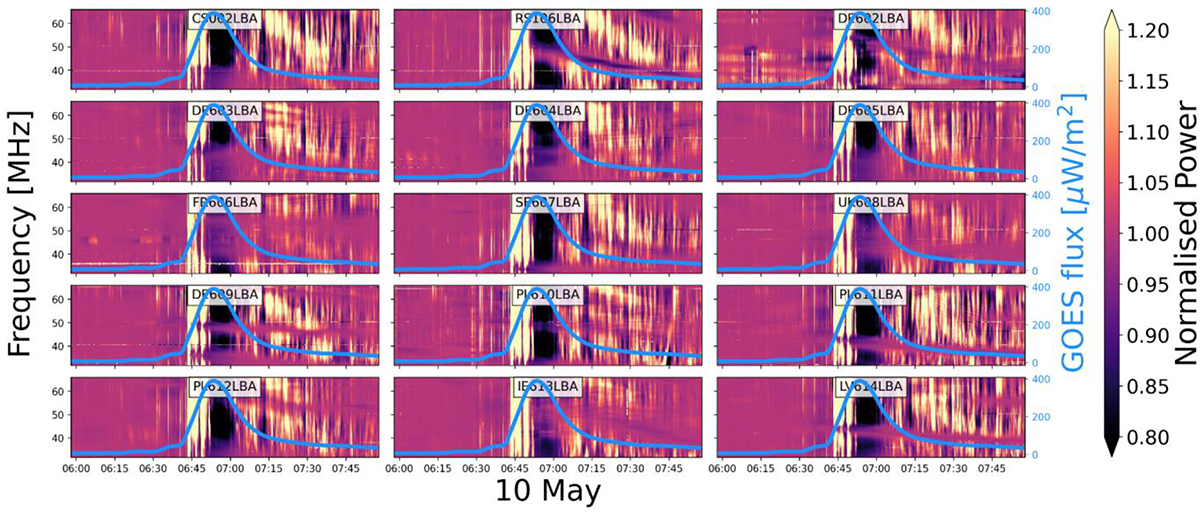
LOFAR normalized intensity data for observation L2040063, covering the period of May 10th from 05:58 until 07:58 UTC. The blue line represents the X-ray flux from GOES.
Current usage metrics show cumulative count of Article Views (full-text article views including HTML views, PDF and ePub downloads, according to the available data) and Abstracts Views on Vision4Press platform.
Data correspond to usage on the plateform after 2015. The current usage metrics is available 48-96 hours after online publication and is updated daily on week days.
Initial download of the metrics may take a while.