Figure 5
Download original image
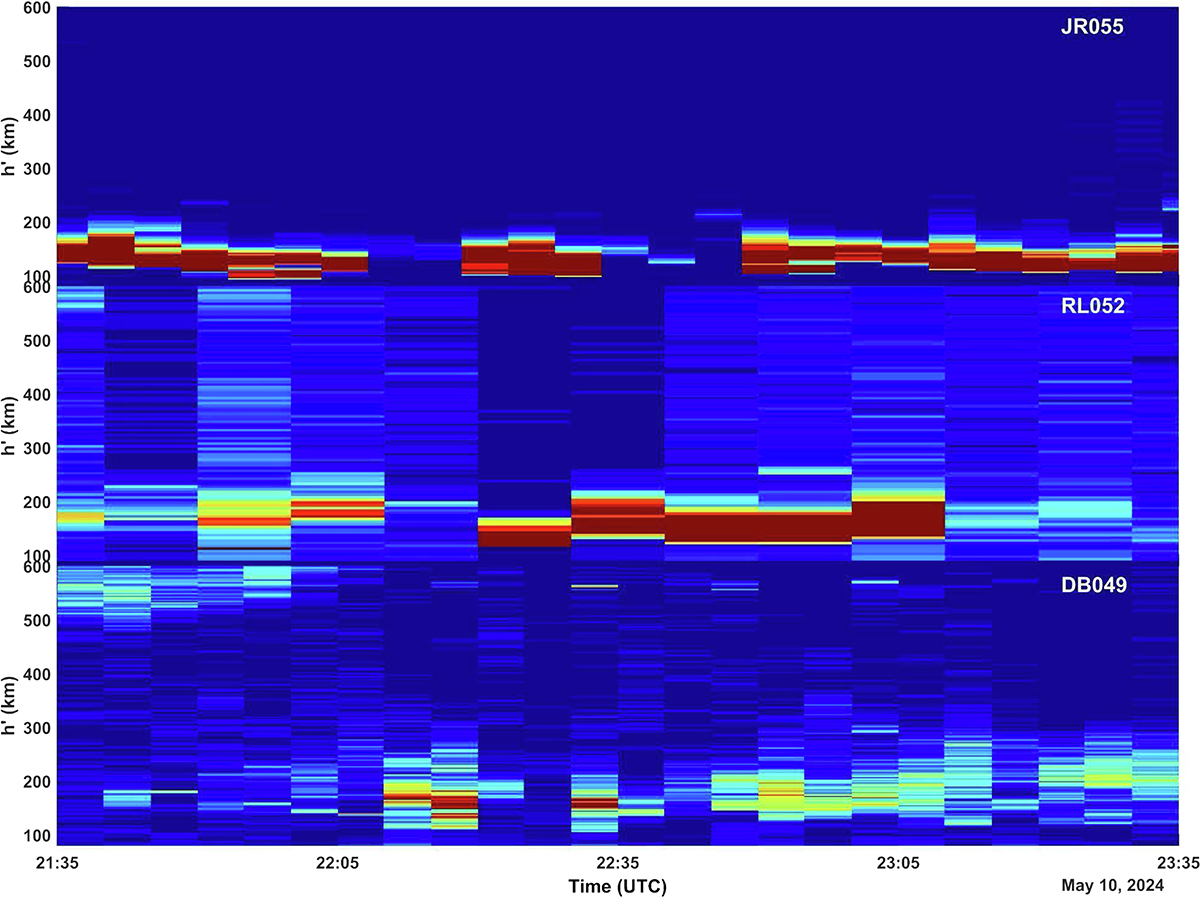
Total echo power summed across all ionospheric echoes from the Juliusruh (top), Chilton (middle), and Dourbes (bottom) ionosondes between 21:35 UTC and 23:35 UTC on May 10th, 2024. The plots were generated in arbitrary decibel units. Interpretation should be considered only qualitatively.
Current usage metrics show cumulative count of Article Views (full-text article views including HTML views, PDF and ePub downloads, according to the available data) and Abstracts Views on Vision4Press platform.
Data correspond to usage on the plateform after 2015. The current usage metrics is available 48-96 hours after online publication and is updated daily on week days.
Initial download of the metrics may take a while.