Figure 1.
Download original image
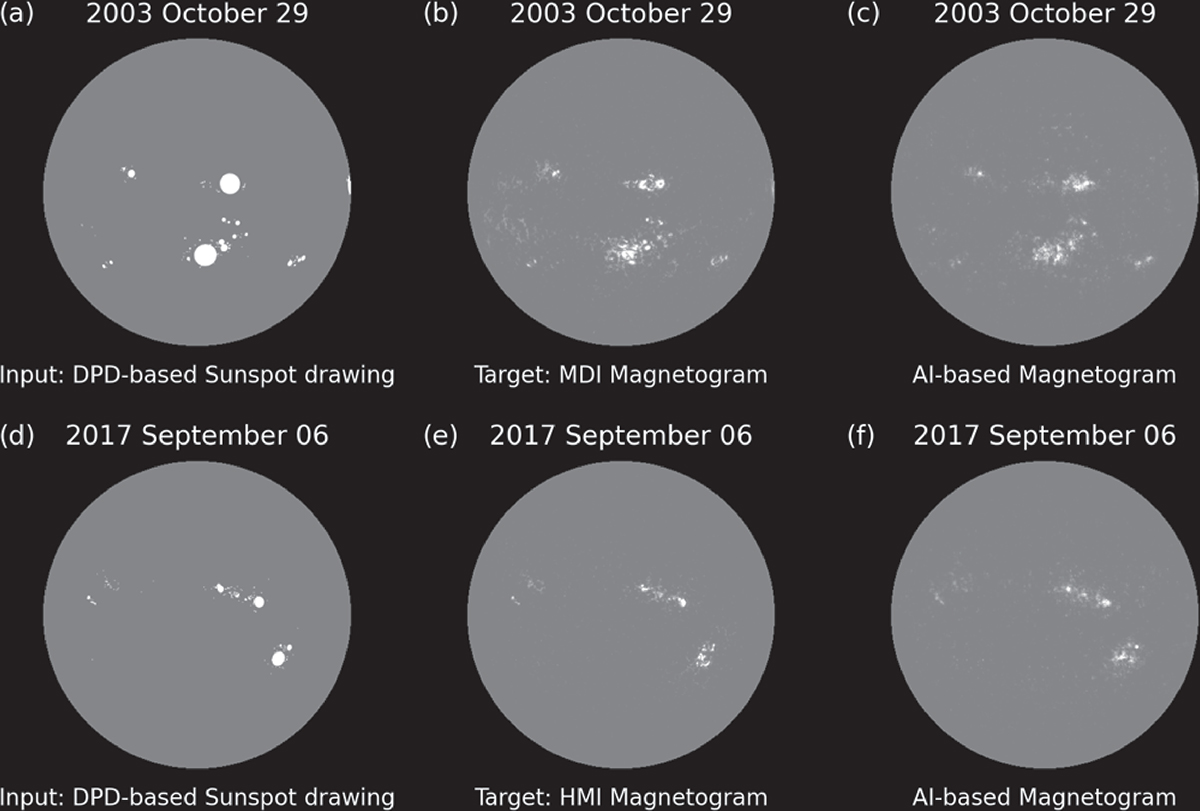
Comparison between MDI/HMI magnetograms and AI-based ones on 2003 October 29 (top), and 2017 September 6 (bottom). Panels (a) and (d) show schematic sunspot drawings constructed from the DPD catalog (DPD-based sunspot drawings), which are used as input to the model. Panels (b) and (e) show the corresponding observed MDI/HMI magnetograms as targets, and panels (c) and (f) show the AI-based magnetograms from our model. The magnetograms in (b), (c), (e), and (f) are byte-scaled to | ± 1000| G for display only.
Current usage metrics show cumulative count of Article Views (full-text article views including HTML views, PDF and ePub downloads, according to the available data) and Abstracts Views on Vision4Press platform.
Data correspond to usage on the plateform after 2015. The current usage metrics is available 48-96 hours after online publication and is updated daily on week days.
Initial download of the metrics may take a while.