Figure 4.
Download original image
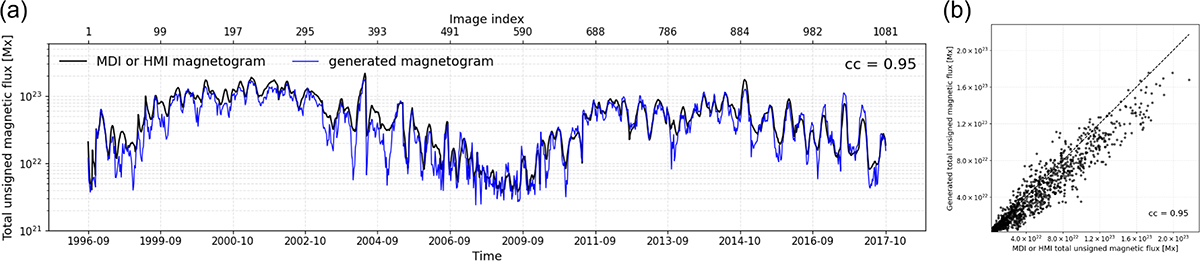
Total unsigned magnetic flux of both original and AI-based ones for the test set. (a) Temporal variations of the total unsigned magnetic flux. The bottom x-axis shows the observation date (year-month) for each DPD test image, while the top x-axis indicates the corresponding image index in the test set (from 1 to N), sorted in time. The black solid line shows variations from the original magnetograms and the blue solid line corresponds to those from the AI-based ones. (b) Scatter plot between the total unsigned magnetic fluxes of the original and AI-based magnetograms.
Current usage metrics show cumulative count of Article Views (full-text article views including HTML views, PDF and ePub downloads, according to the available data) and Abstracts Views on Vision4Press platform.
Data correspond to usage on the plateform after 2015. The current usage metrics is available 48-96 hours after online publication and is updated daily on week days.
Initial download of the metrics may take a while.