Figure 5.
Download original image
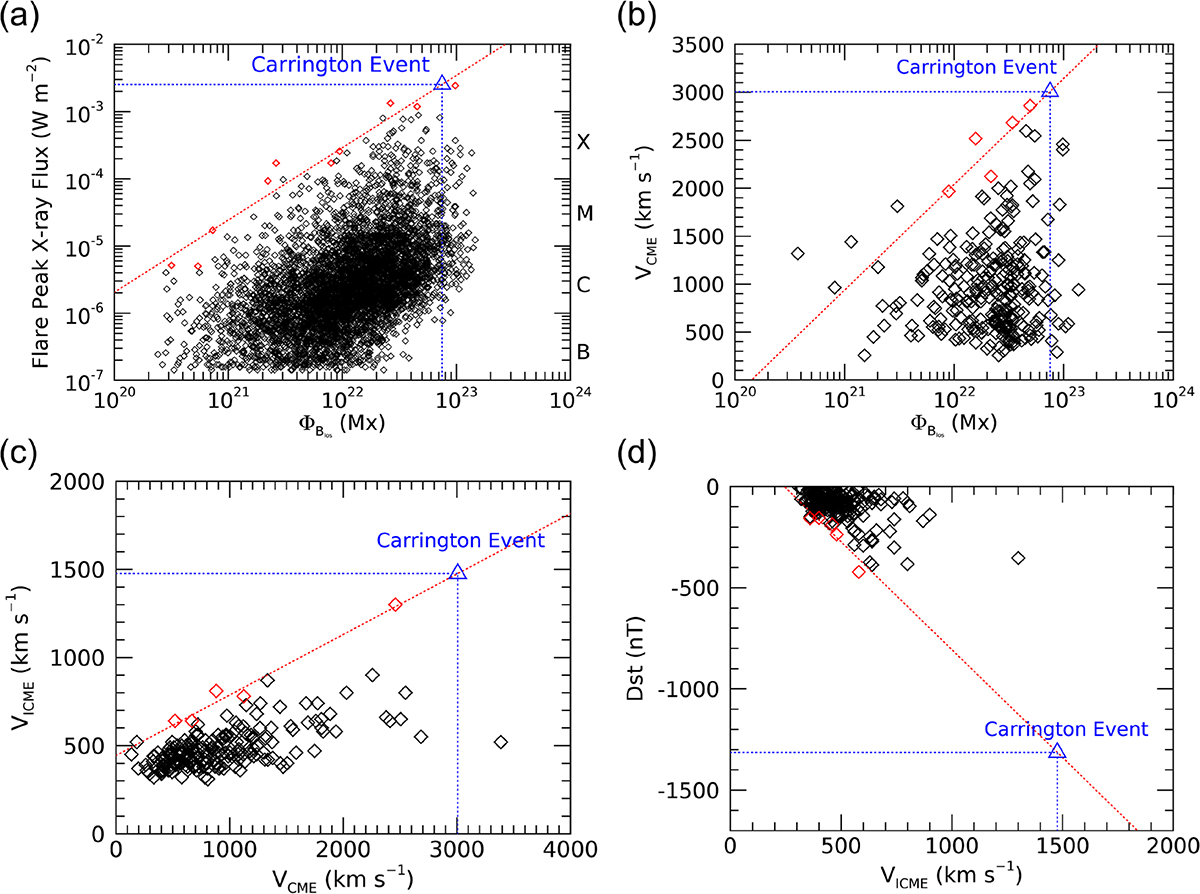
Solar and geomagnetic activities from empirical relationships: (a) flare peak flux vs. magnetic flux, (b) CME speed vs. magnetic flux, (c) ICME speed vs. CME speed, (d) Dst value vs. ICME speed. Red dotted lines show the linear fittings from the red diamonds corresponding to each group’s most extreme value. The estimates of the Carrington event are shown in blue triangles.
Current usage metrics show cumulative count of Article Views (full-text article views including HTML views, PDF and ePub downloads, according to the available data) and Abstracts Views on Vision4Press platform.
Data correspond to usage on the plateform after 2015. The current usage metrics is available 48-96 hours after online publication and is updated daily on week days.
Initial download of the metrics may take a while.