Figure 3.
Download original image
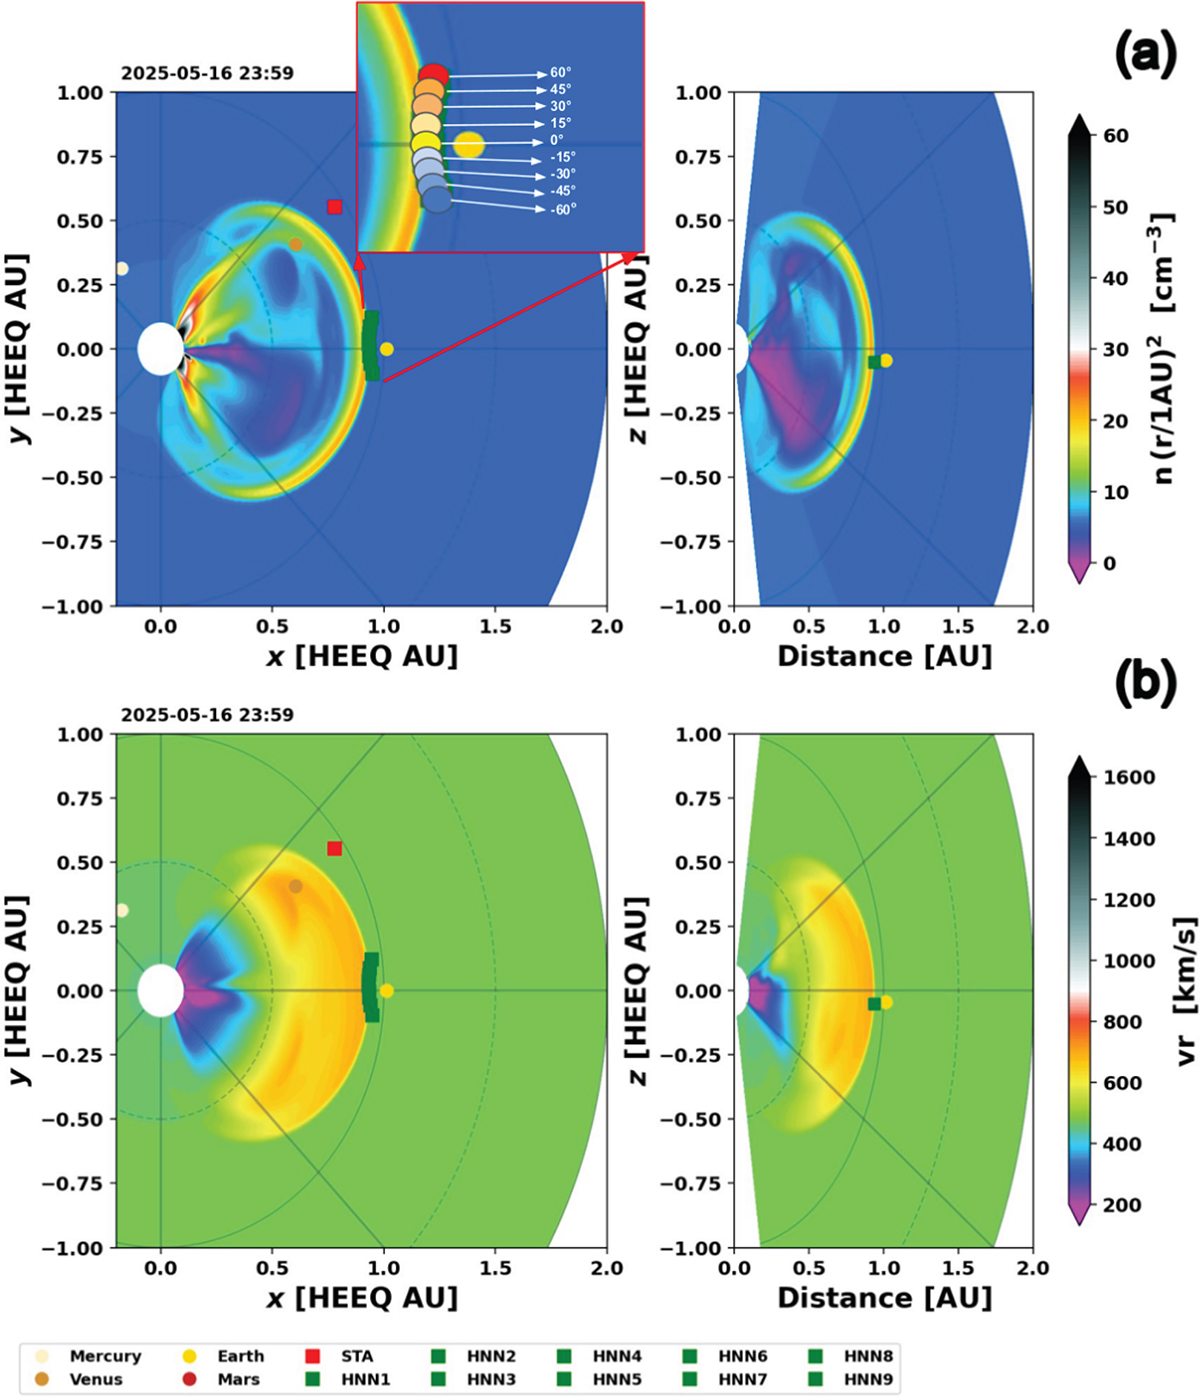
RUN1 simulation results at the time of arrival of the CME-driven shock at the HENON virtual spacecraft, indicated as HNN (see legend), positioned directly in front of the Earth, along the Sun-Earth line. Top row: detrended density in the equatorial plane (left) and in the meridional plane (right), with the colorbar on the right-hand side (panel a). Bottom row: radial velocity in the equatorial plane (left) and in the meridional plane (right), with the colorbar on the right-hand side (panel b). A yellow dot indicates the Earth’s position, while green squares indicate the virtual spacecraft locations. In the inset we indicated the geocentric position of the virtual spacecraft in different colors.
Current usage metrics show cumulative count of Article Views (full-text article views including HTML views, PDF and ePub downloads, according to the available data) and Abstracts Views on Vision4Press platform.
Data correspond to usage on the plateform after 2015. The current usage metrics is available 48-96 hours after online publication and is updated daily on week days.
Initial download of the metrics may take a while.