Open Access
Figure 12.
Download original image
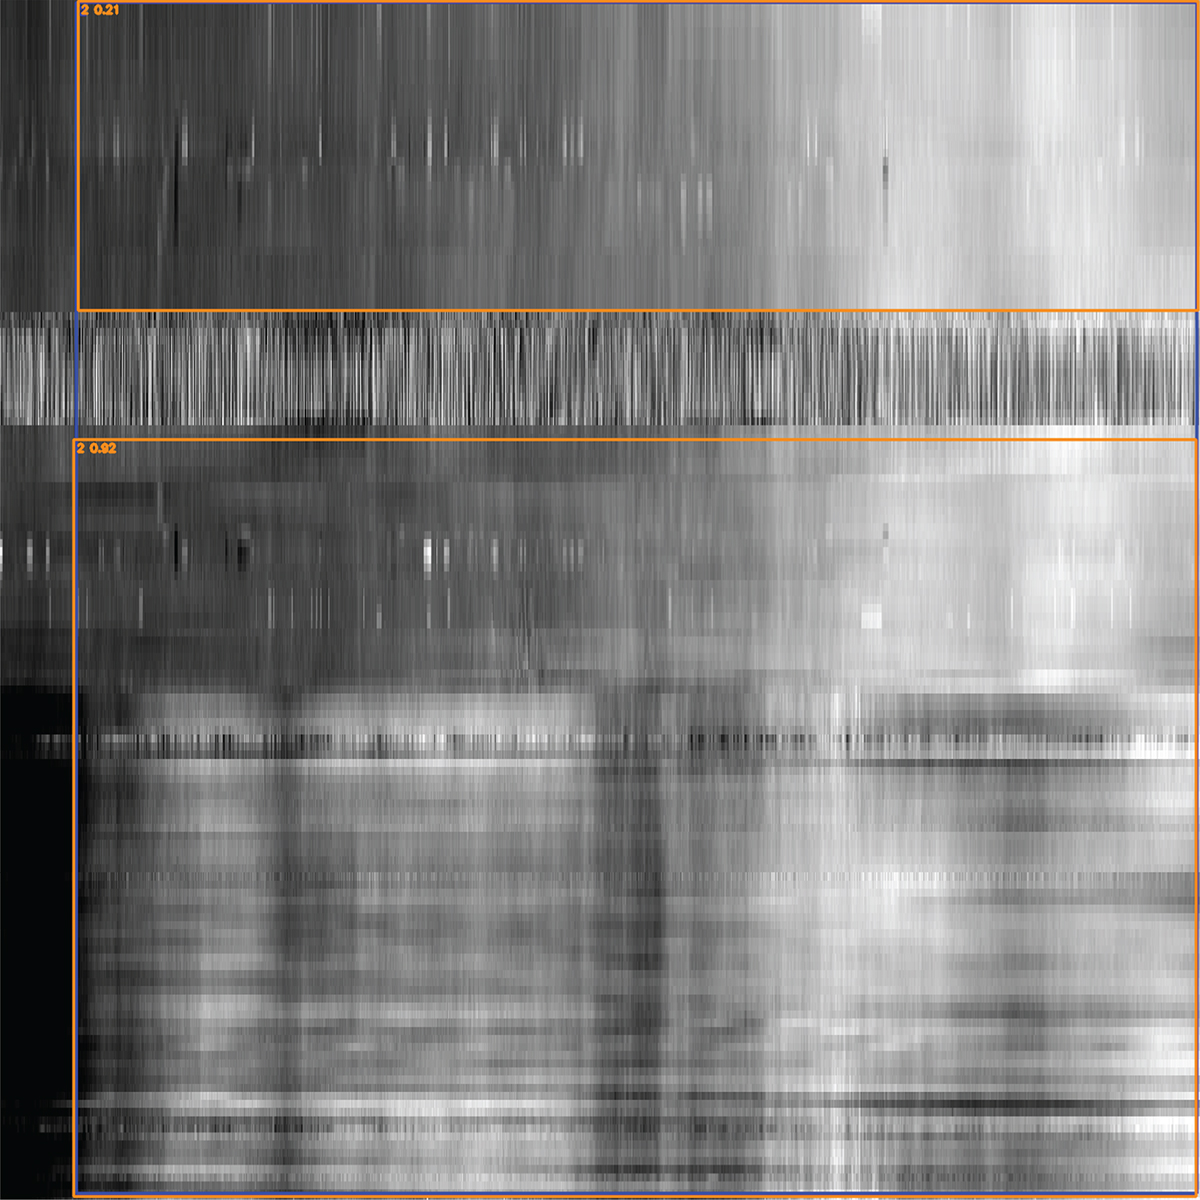
Spectrogram from the AUSTRIA-OE3FLB station showing a Type IV burst. Blue rectangles indicate ground truth, orange rectangles show predictions by the best Weighted Box Fusion model. The spectrogram covers a 15 min time span (x-axis) and a frequency range (y-axis) from 450 MHz to 50 MHz.
Current usage metrics show cumulative count of Article Views (full-text article views including HTML views, PDF and ePub downloads, according to the available data) and Abstracts Views on Vision4Press platform.
Data correspond to usage on the plateform after 2015. The current usage metrics is available 48-96 hours after online publication and is updated daily on week days.
Initial download of the metrics may take a while.