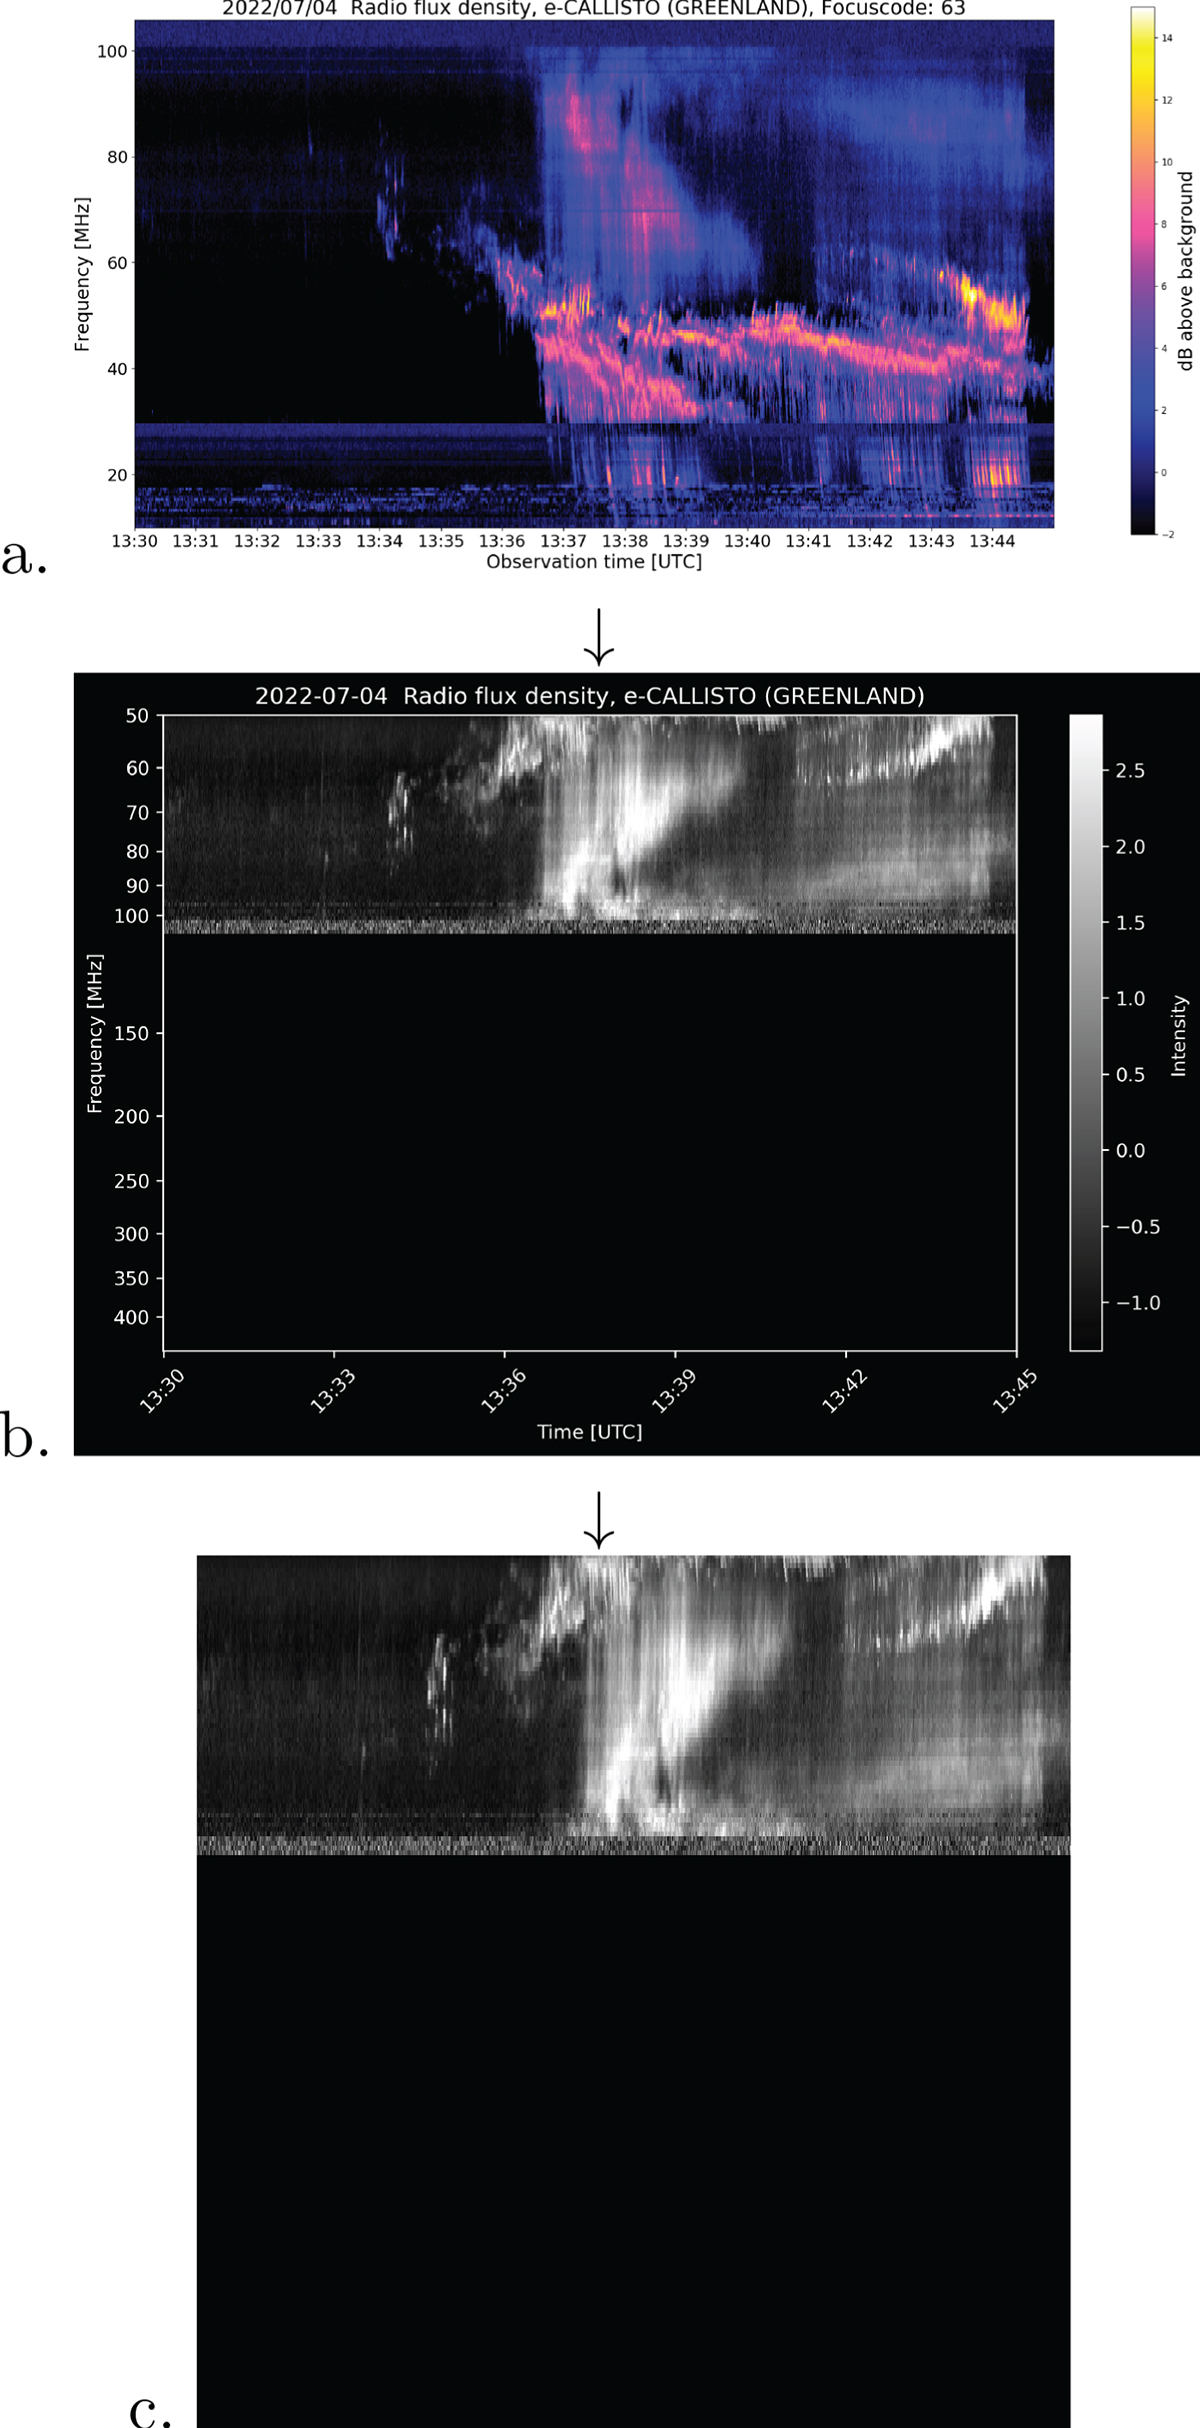
Figure 3.
Download original image
Main steps of spectrogram preprocessing: (a) default spectrogram on e-CALLISTO website, (b) rebinned and normalized on the same frequency axis for all spectrograms, (c) final resized image without axis labels. All three figures have the same x-axis ranges, covering a 15 min time span, while figures (b) and (c) have the same frequency range (y-axis) from 450 MHz to 50 MHz.
Current usage metrics show cumulative count of Article Views (full-text article views including HTML views, PDF and ePub downloads, according to the available data) and Abstracts Views on Vision4Press platform.
Data correspond to usage on the plateform after 2015. The current usage metrics is available 48-96 hours after online publication and is updated daily on week days.
Initial download of the metrics may take a while.