Fig. 12.
Download original image
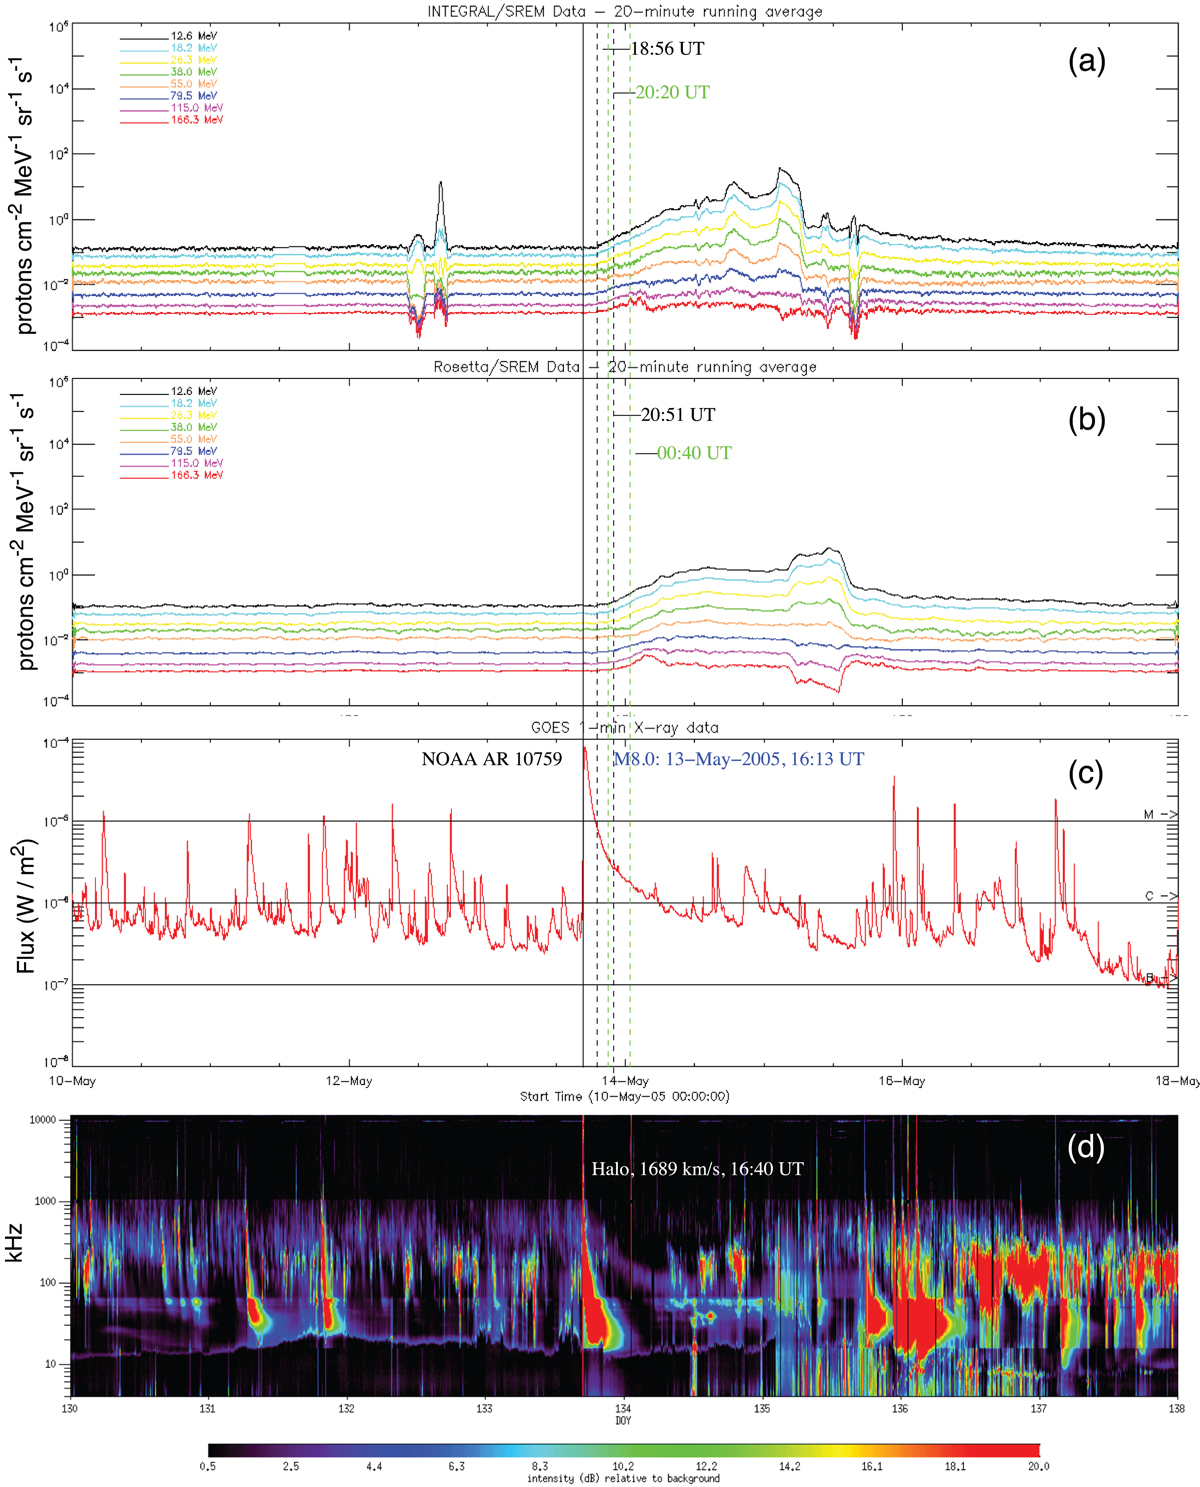
Solar coronal conditions between 2005 May 10 and 18, including SEP event I13/R7. (a) 20-minute running averages of the INTEGRAL/SREM particle flux timeseries, (b) 20-minute running averages of the Rosetta/SREM particle flux timeseries, (c) GOES 1–8 Å solar X-ray flux and (d) WIND/WAVES frequency-time radio spectrum. The vertical solid black line indicates the onset time of the flare related to the SEP events source eruption. The flare information is annotated in (c) and the source CME information is annotated in (d). The first dashed black line at 18:56 UT on May 13 indicates the SEP event onset time observed first by the lowest energy channel of INTEGRAL/SREM. It was also the lowest energy channel of Rosetta/SREM which was the first channel to detect the SEP event (20:51 UT, second black vertical dashed line). The colors used in (a) and (b) correspond to the different energy channels of the SREM detectors.
Current usage metrics show cumulative count of Article Views (full-text article views including HTML views, PDF and ePub downloads, according to the available data) and Abstracts Views on Vision4Press platform.
Data correspond to usage on the plateform after 2015. The current usage metrics is available 48-96 hours after online publication and is updated daily on week days.
Initial download of the metrics may take a while.