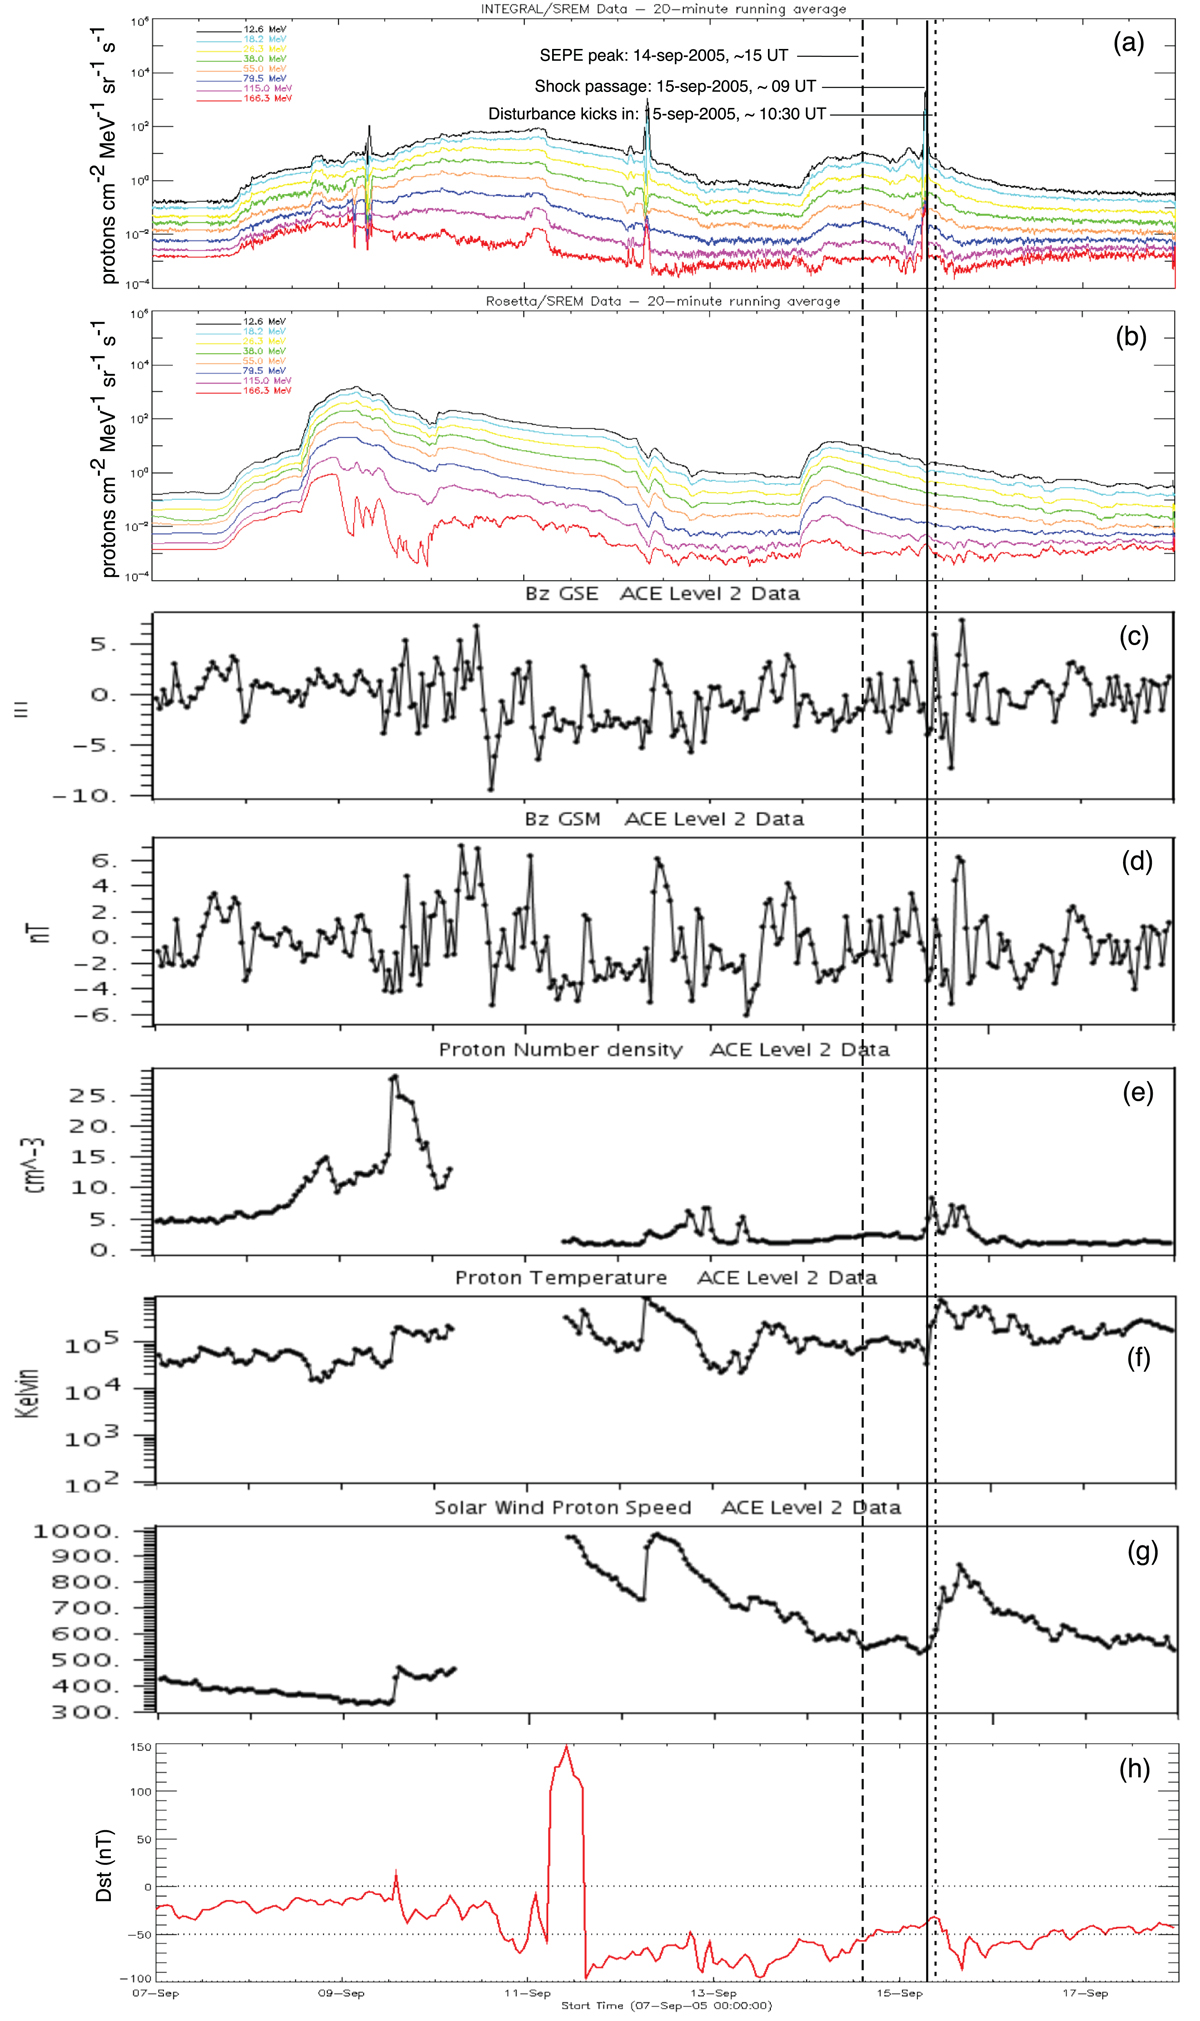
Fig. 19.
Download original image
IP conditions between 2005 September 7 and 18, including SEP event I20/R13. 20-minute running averages of the INTEGRAL/SREM particle flux timeseries, (b) 20-minute running averages of the Rosetta/SREM particle flux timeseries, ACE/MAG Bz-components in GSE (c) and GSM (d) coordinates and ACE/SWEPAM measurements of proton number density (e), proton temperature (f) and SW proton velocity (g). The respective definitive Dst-index values are given in (h). The three vertical lines indicate the times of the SEP event’s peak (dashed), the shock crossing from L1 (solid), and the onset of the magnetospheric disturbance (dotted). All respective dates and times are annotated in (a).
Current usage metrics show cumulative count of Article Views (full-text article views including HTML views, PDF and ePub downloads, according to the available data) and Abstracts Views on Vision4Press platform.
Data correspond to usage on the plateform after 2015. The current usage metrics is available 48-96 hours after online publication and is updated daily on week days.
Initial download of the metrics may take a while.