Fig. 3.
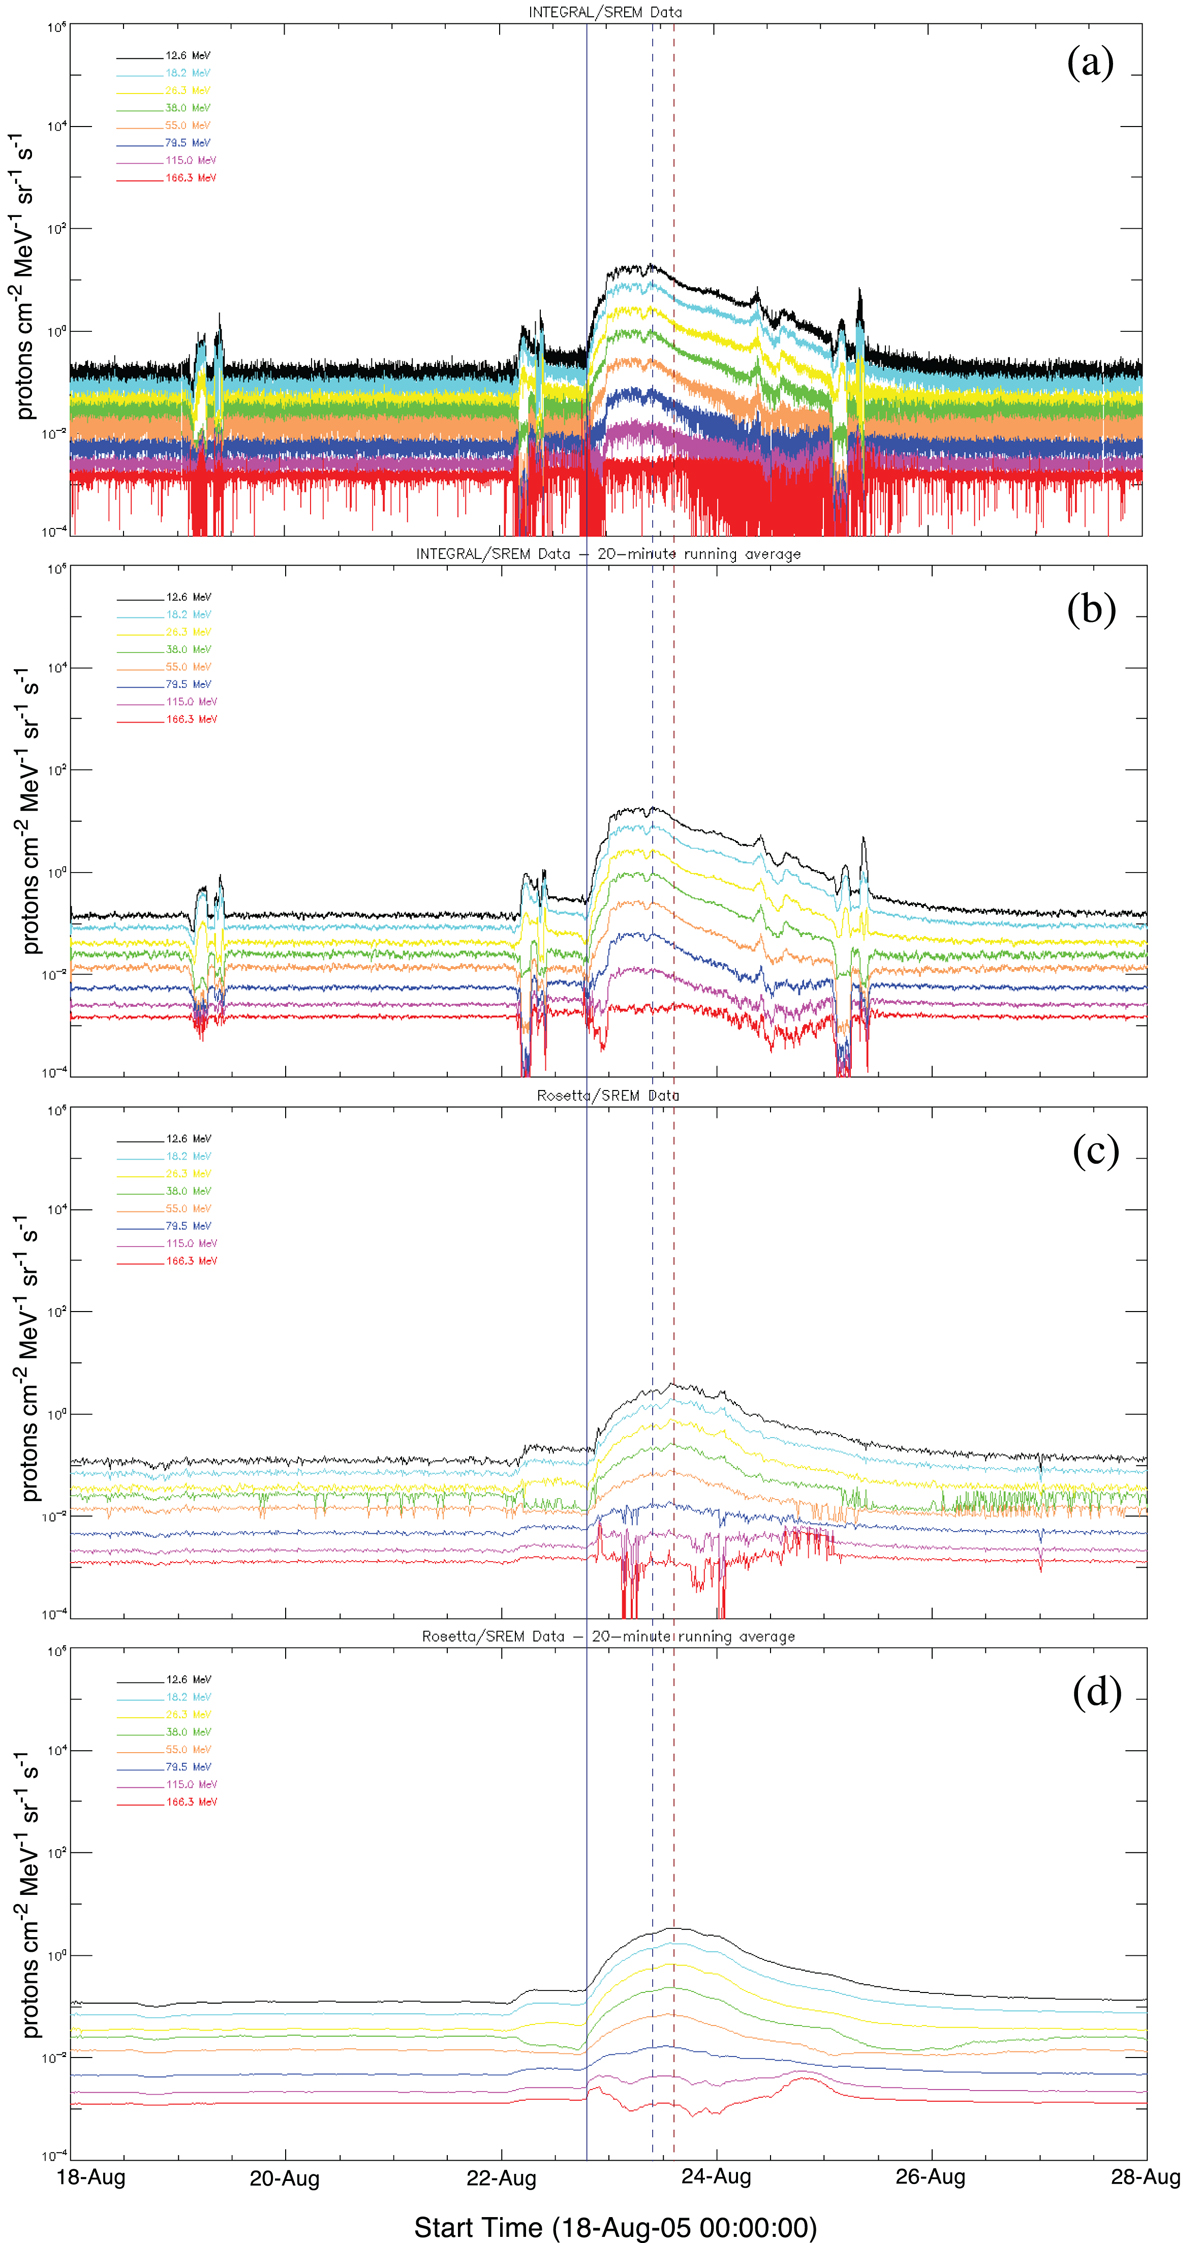
Download original image
SREM proton flux timeseries registered between August 18 and 28, 2005 for eight different energy channels, from low (12.6 MeV; black) to high (166.3 MeV; red). Unsmoothed INTEGRAL (a) and Rosetta (c) are shown, with their respective 20-minute running averages in (b) and (d). The timeseries include SREM SEP events I18 and R11 (see also Table 2). The INTEGRAL SEP event’s onset time, roughly coinciding with the SEP event recorded onboard Rosetta, is shown by the solid blue line. The INTEGRAL and Rosetta peaks are shown by the dashed blue and brown lines, respectively.
Current usage metrics show cumulative count of Article Views (full-text article views including HTML views, PDF and ePub downloads, according to the available data) and Abstracts Views on Vision4Press platform.
Data correspond to usage on the plateform after 2015. The current usage metrics is available 48-96 hours after online publication and is updated daily on week days.
Initial download of the metrics may take a while.