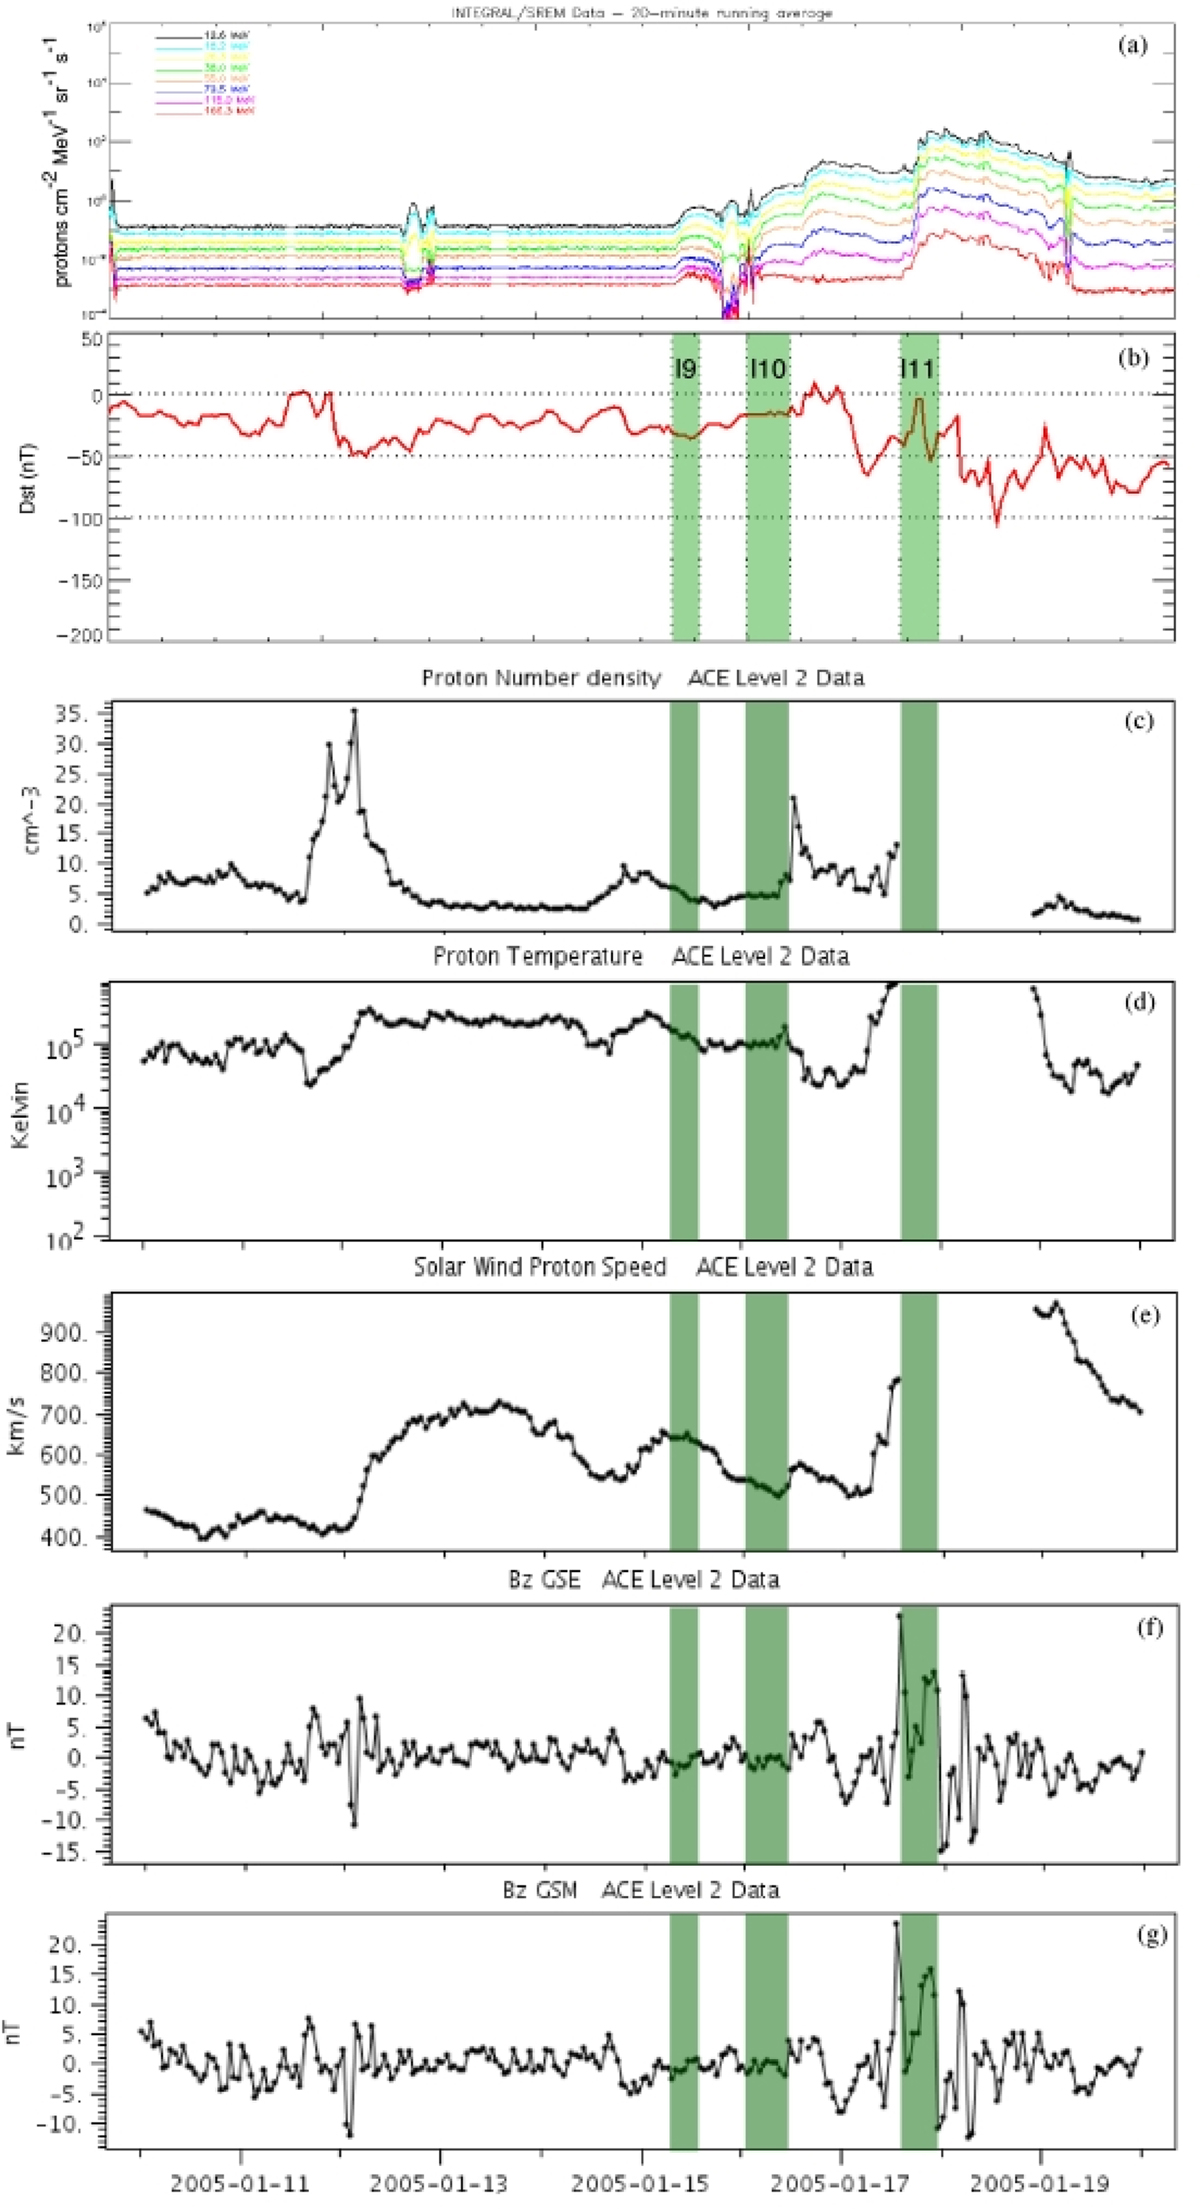
Fig. 7.
Download original image
Essential IP information for three INTEGRAL/SREM SEP events (I9–I11) detected in 2005 January. (a) 20-minute running average of the INTEGRAL/SREM flux timeseries between 2005 DOY 10 and 20 (January 10–20). (b) Hourly-averaged timeseries of the Dst index for the same time interval. The information from ACE/SWEPAM includes hourly averages of the SW proton number density (c), temperature (d), and speed (e), while the information from ACE/MAG includes the hourly-averaged GSE (f) and GSM (g) Bz-components. Notice a data gap in the ACE/SWEPAM measurements from midday January 17 to roughly January 19. The green-shaded areas in (b–g) indicate the time interval between the onset and the peak of the three SEP events.
Current usage metrics show cumulative count of Article Views (full-text article views including HTML views, PDF and ePub downloads, according to the available data) and Abstracts Views on Vision4Press platform.
Data correspond to usage on the plateform after 2015. The current usage metrics is available 48-96 hours after online publication and is updated daily on week days.
Initial download of the metrics may take a while.