Fig. 10.
Download original image
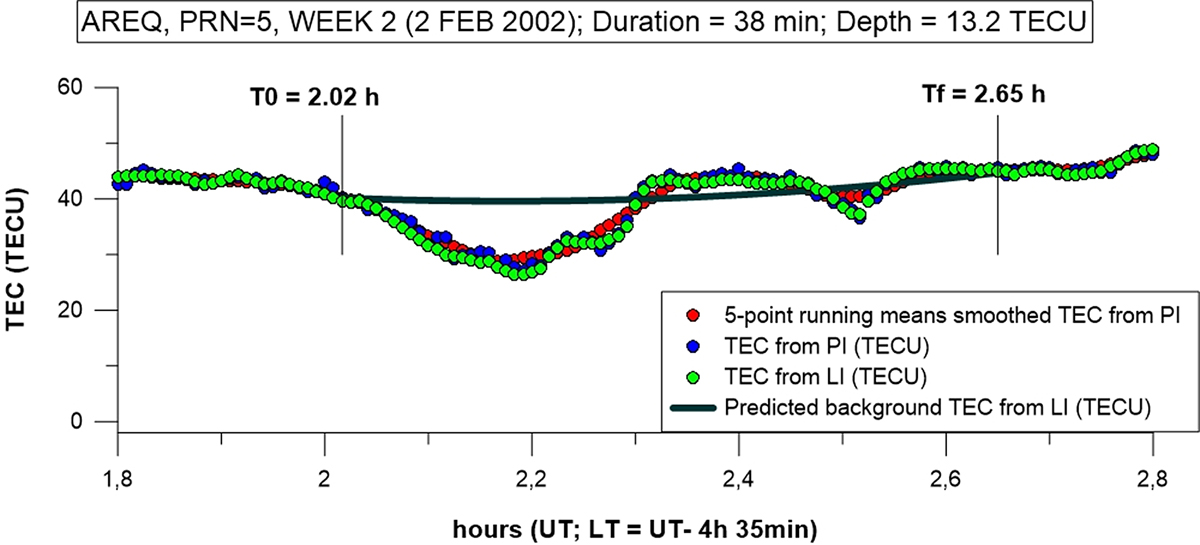
TEC depletion detected on 2nd February 2002 at 2:02 UT (~21:26 LT of previous day) from the areq GNSS receiver using the Equatorial Plasma Bubbles automatic detection tool described in Section 3. Depletion related with an EPB of 13.2 TECUs depth and a duration of 38 min. Light green dots: estimated TEC from LI (TECU). Blue dots: TEC from PI (TECU). Red dots: the 5-point running means smoothed TEC from PI (TECU) with an elevation mask of 20°. Dark green line: predicted background TEC from LI (TECU). Vertical lines whose values are shown in the legend mark the initial time (T 0) and final time (T f) of the bubble detection.
Current usage metrics show cumulative count of Article Views (full-text article views including HTML views, PDF and ePub downloads, according to the available data) and Abstracts Views on Vision4Press platform.
Data correspond to usage on the plateform after 2015. The current usage metrics is available 48-96 hours after online publication and is updated daily on week days.
Initial download of the metrics may take a while.