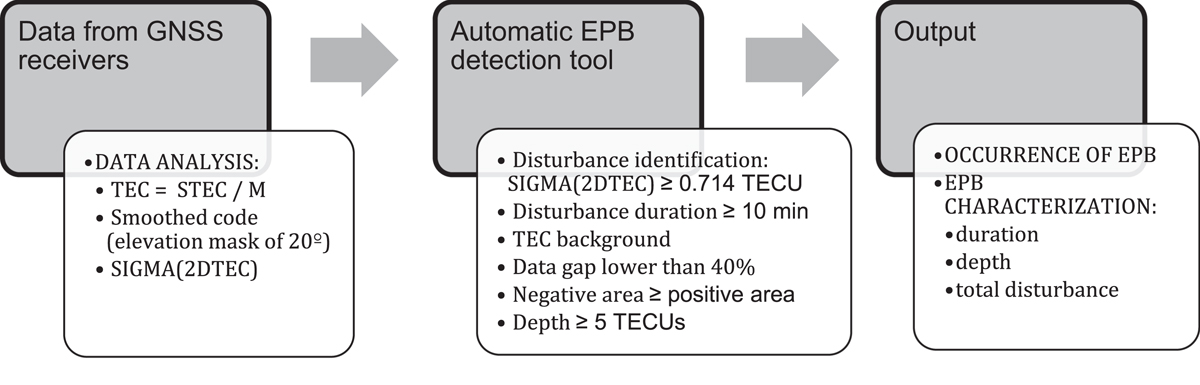
Fig. 6.
Download original image
An example of the output of the automatic bubble detection tool for BAKO receiver, 12 October 2014 and satellite 21. Upper panel: Estimated TEC from LI (TECU) (light green dots), TEC from PI (TECU) (blue dots), the 5-point running means smoothed TEC from PI (TECU) with an elevation mask of 20° (red dots) and the predicted background TEC from LI (TECU) (dark green line). Vertical lines whose values are shown in the legend mark T 0 and T f. Middle panel: SIGMA(2DTEC) (TECU), where the horizontal blue line indicates the threshold value (0.075 m2 = 0.714 TECU) defining T 0 and T f, and in turn ETD. Bottom panel: Difference between predicted background TEC and estimated TEC, ∆TEC(t) (TECU), from which we calculate the bubble Depth and the total disturbance TDB.
Current usage metrics show cumulative count of Article Views (full-text article views including HTML views, PDF and ePub downloads, according to the available data) and Abstracts Views on Vision4Press platform.
Data correspond to usage on the plateform after 2015. The current usage metrics is available 48-96 hours after online publication and is updated daily on week days.
Initial download of the metrics may take a while.