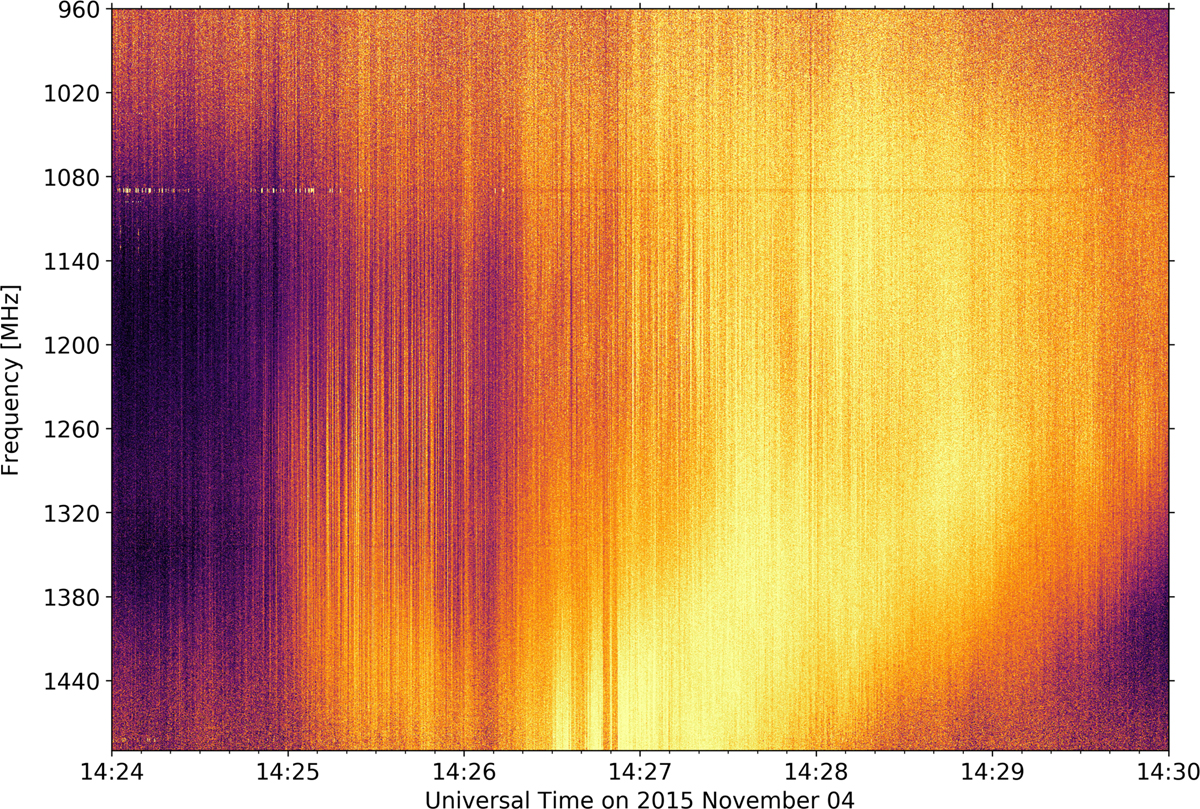
Fig. 6.

Download original image
Dynamic radio spectrum observed with HSRS around the peak of the strong emission. Note that the flux density scale was set independently for the individual frequencies. The apparent maximum near 1400 MHz is an artifact of this procedure. The horizontal line at 1090 MHz, is actually the downlink part of a secondary ATC radar transmission close the station of Humain.
Current usage metrics show cumulative count of Article Views (full-text article views including HTML views, PDF and ePub downloads, according to the available data) and Abstracts Views on Vision4Press platform.
Data correspond to usage on the plateform after 2015. The current usage metrics is available 48-96 hours after online publication and is updated daily on week days.
Initial download of the metrics may take a while.


