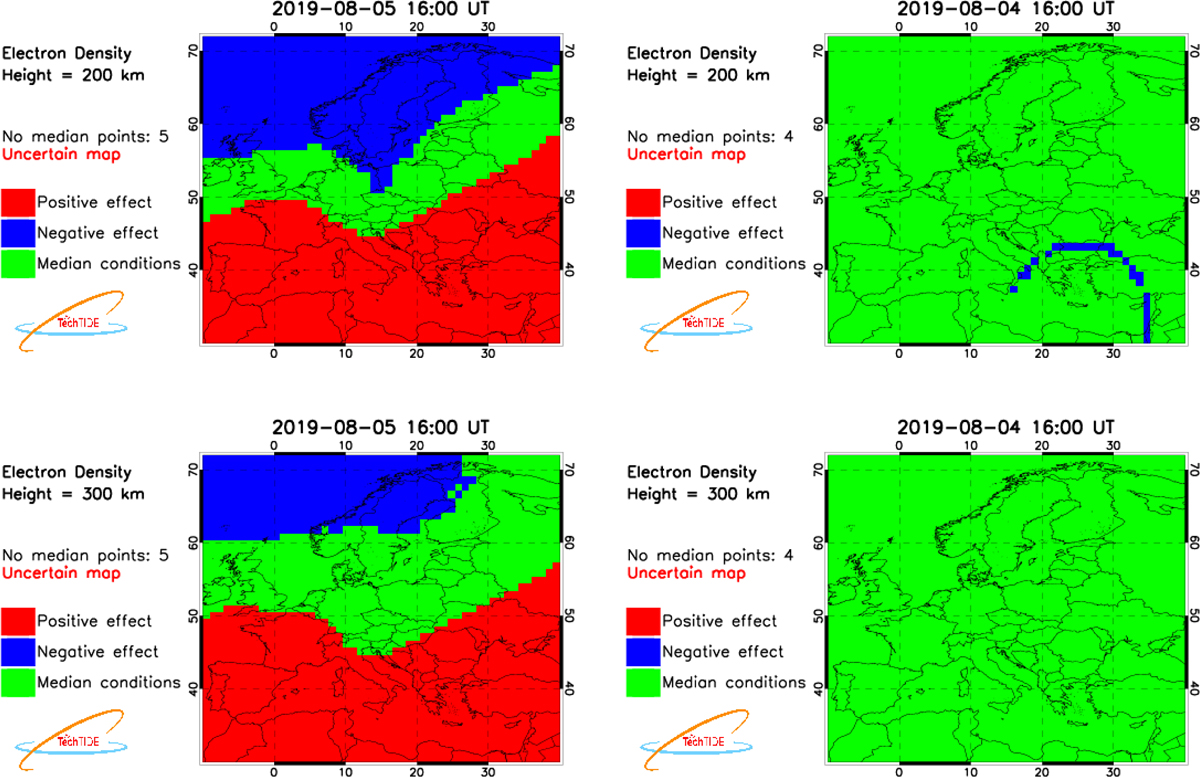
Fig. 9
Download original image
Ionospheric background activity maps calculated during the main phase of a moderate storm (left) and during a quiet day (right), using the relative standard deviation of the electron density at each ionospheric altitude, taken into account for the estimation of the median values. Here the maps at 200 km (top row) and at 300 km (bottom row) are presented.
Current usage metrics show cumulative count of Article Views (full-text article views including HTML views, PDF and ePub downloads, according to the available data) and Abstracts Views on Vision4Press platform.
Data correspond to usage on the plateform after 2015. The current usage metrics is available 48-96 hours after online publication and is updated daily on week days.
Initial download of the metrics may take a while.