Open Access
Fig. 3
Download original image
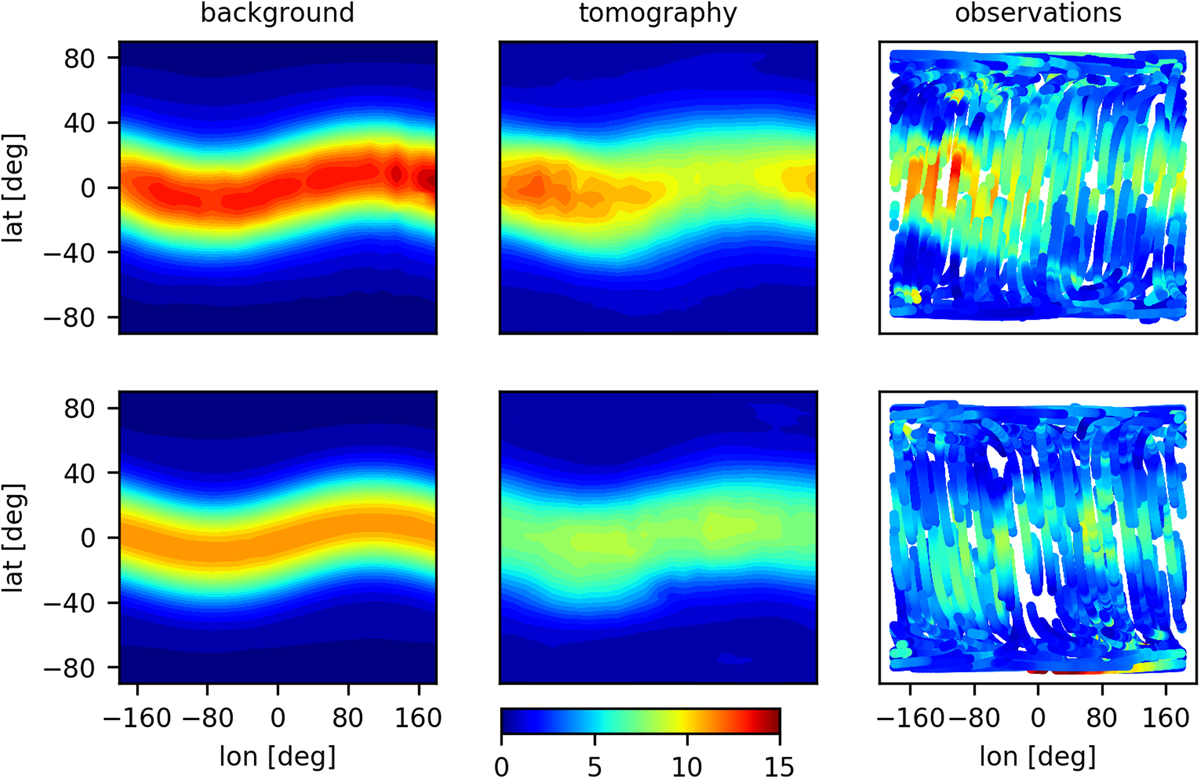
Comparison between VTEC maps obtained with the developed tomography, background, and used METOP observations (DOY 076/2015). Images of the top panel are related to the METOP orbit rising phase and in bottom panel are related to the METOP orbit setting phase. The unit of the color bar is TECU.
Current usage metrics show cumulative count of Article Views (full-text article views including HTML views, PDF and ePub downloads, according to the available data) and Abstracts Views on Vision4Press platform.
Data correspond to usage on the plateform after 2015. The current usage metrics is available 48-96 hours after online publication and is updated daily on week days.
Initial download of the metrics may take a while.