Fig. 4
Download original image
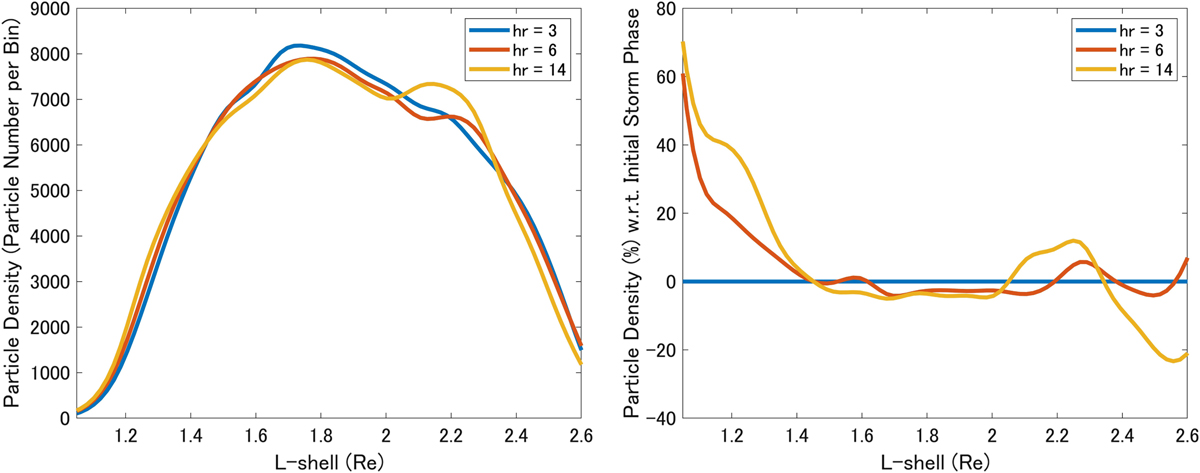
The left panel visualizes the proton density distribution along the L-shells during the three phases of the geomagnetic storm (blue line: initial phase, red line: main phase and yellow line: recovery phase), while the right panel shows the proton density variations (increase and decrease) with respect to the initial storm phase. The particle density is determined over the same energy as in Figure 3.
Current usage metrics show cumulative count of Article Views (full-text article views including HTML views, PDF and ePub downloads, according to the available data) and Abstracts Views on Vision4Press platform.
Data correspond to usage on the plateform after 2015. The current usage metrics is available 48-96 hours after online publication and is updated daily on week days.
Initial download of the metrics may take a while.