Open Access
Fig. 13
Download original image
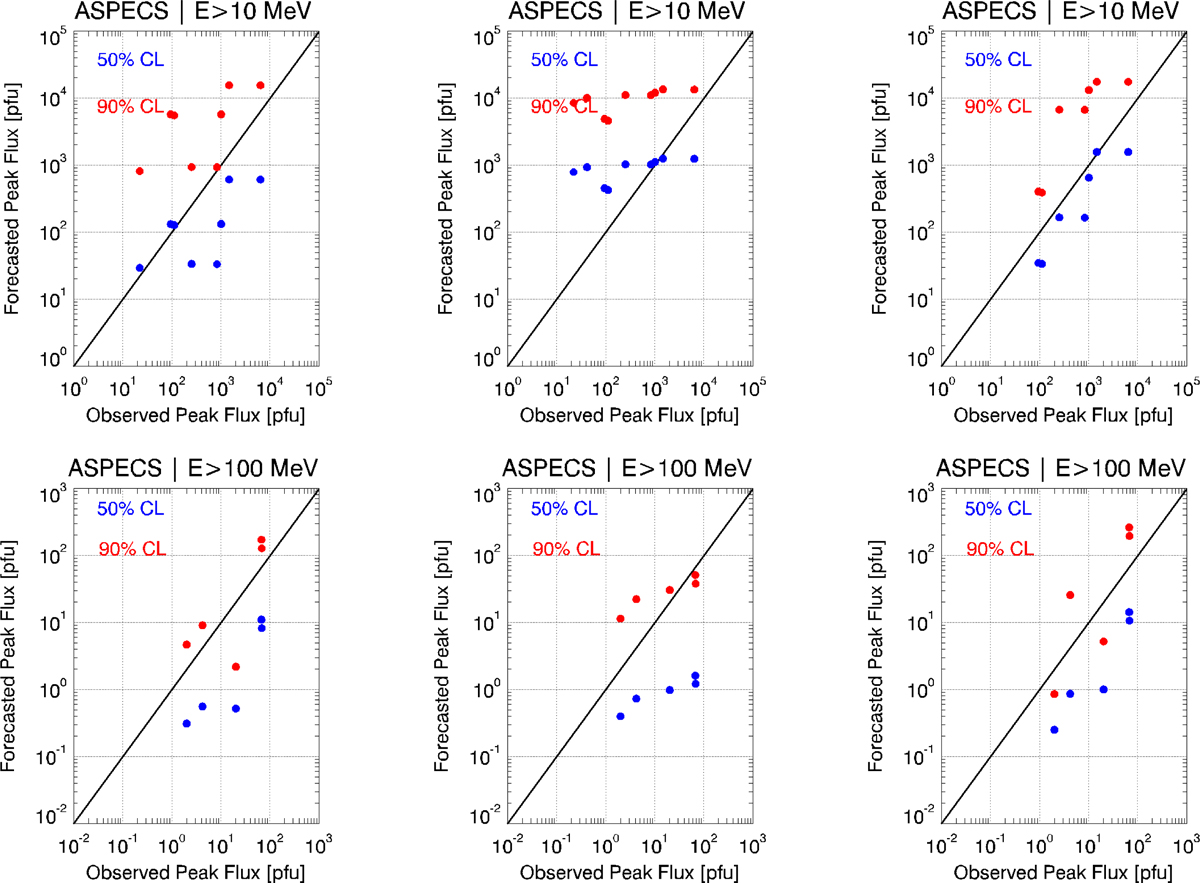
Comparison of predicted with observed peak flux for the SEP events of Table 5, based on solar flare (column at the left-hand side), CME (column in the middle), and solar flare & CME (column at the right-hand side) input data. The top row refers to integral energy of E > 10 MeV and the bottom to E > 100 MeV.
Current usage metrics show cumulative count of Article Views (full-text article views including HTML views, PDF and ePub downloads, according to the available data) and Abstracts Views on Vision4Press platform.
Data correspond to usage on the plateform after 2015. The current usage metrics is available 48-96 hours after online publication and is updated daily on week days.
Initial download of the metrics may take a while.