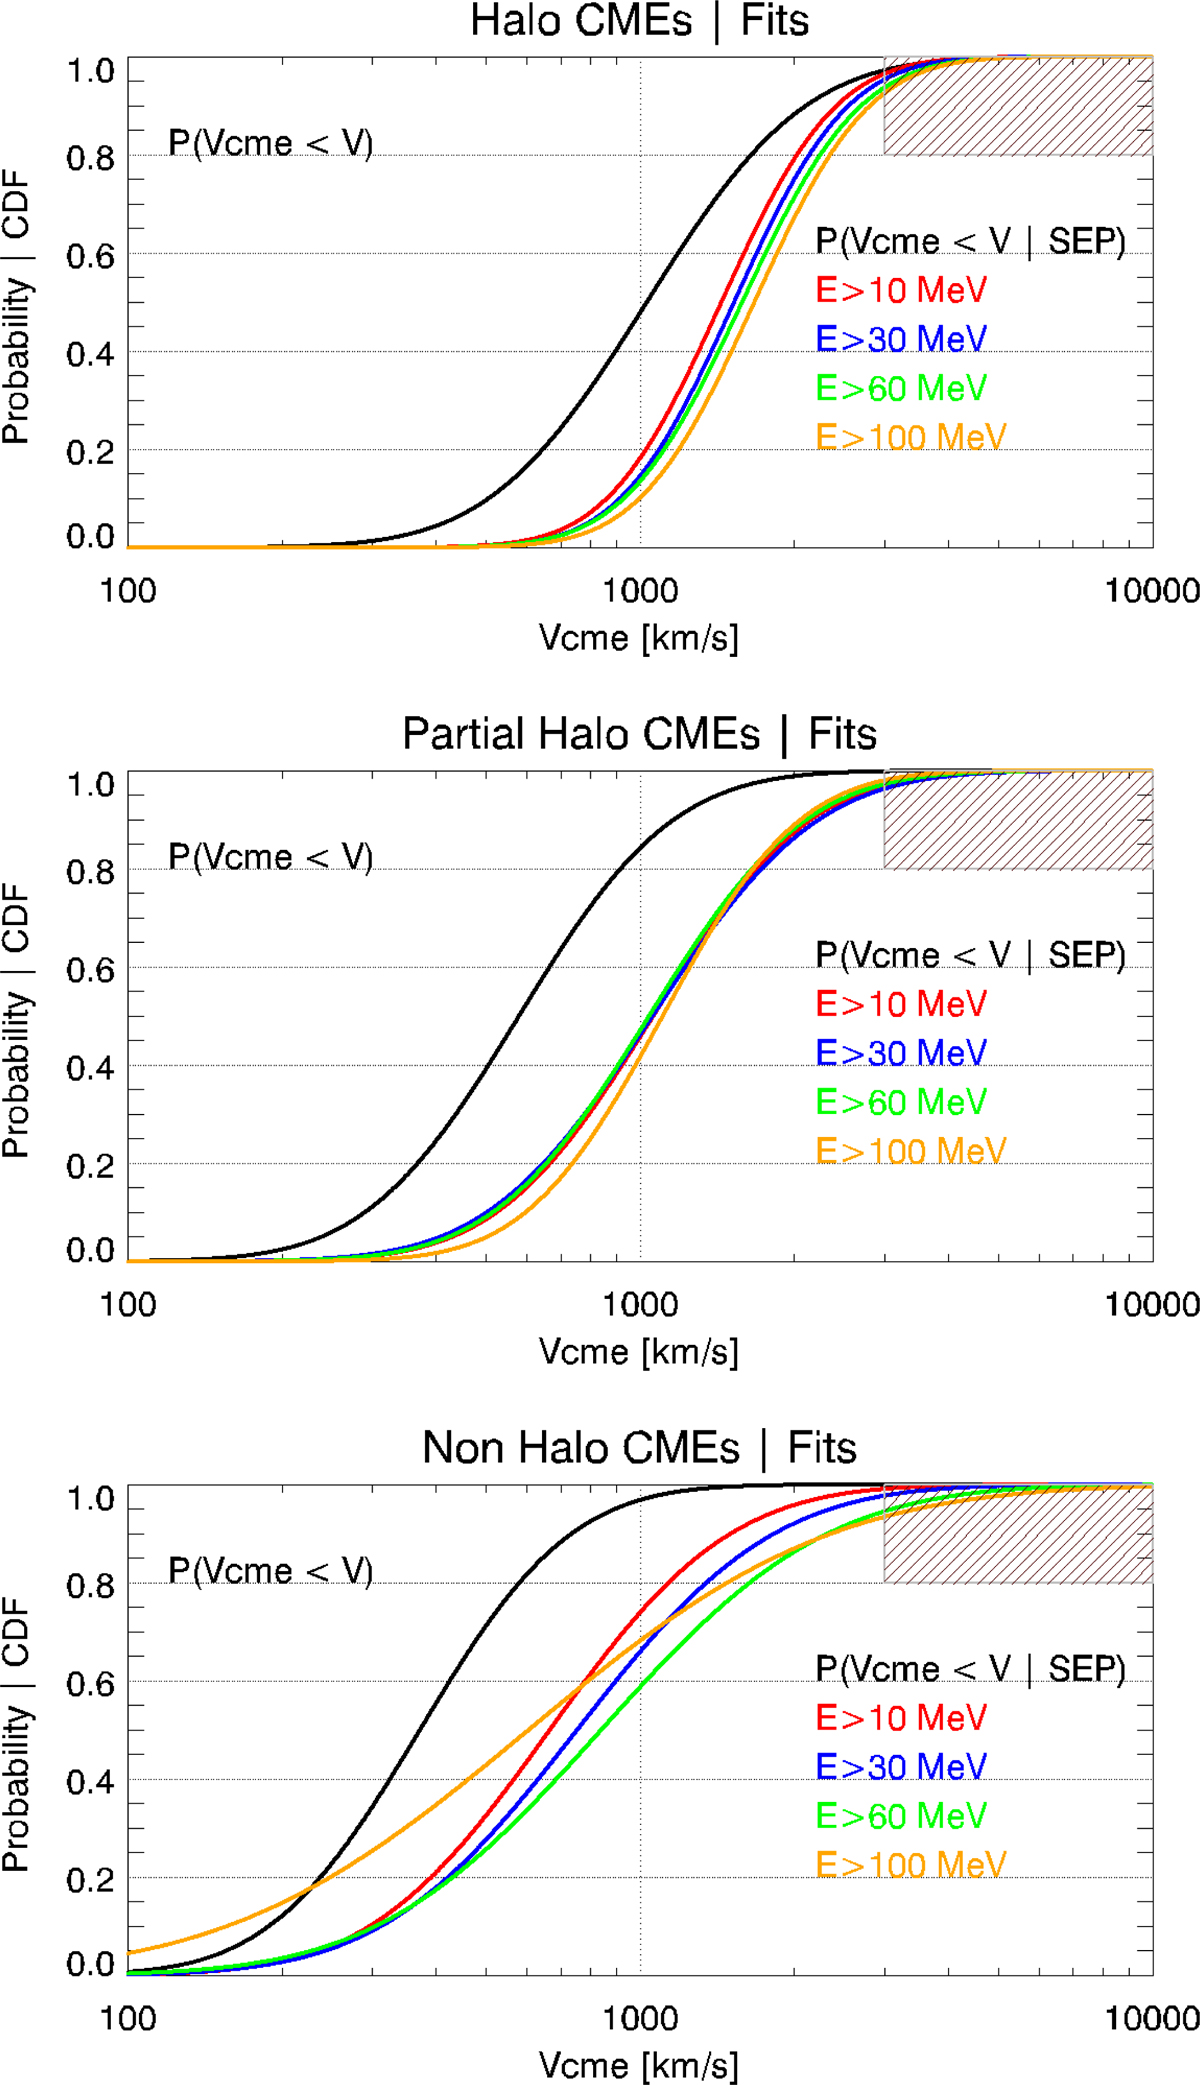
Fig. 4
Download original image
The Cumulative Distribution Functions (CDFs) for the case of Halo CMEs (top panel); Partial Halo CMEs (middle panel), and Non-Halo CMEs (bottom panel). The black color represents all CMEs in the respective sample, whereas CMEs associated with SEP events for different integral energies are color-coded. The gray border hatched rectangle area provides the limit for the V CME.
Current usage metrics show cumulative count of Article Views (full-text article views including HTML views, PDF and ePub downloads, according to the available data) and Abstracts Views on Vision4Press platform.
Data correspond to usage on the plateform after 2015. The current usage metrics is available 48-96 hours after online publication and is updated daily on week days.
Initial download of the metrics may take a while.