Fig. 8
Download original image
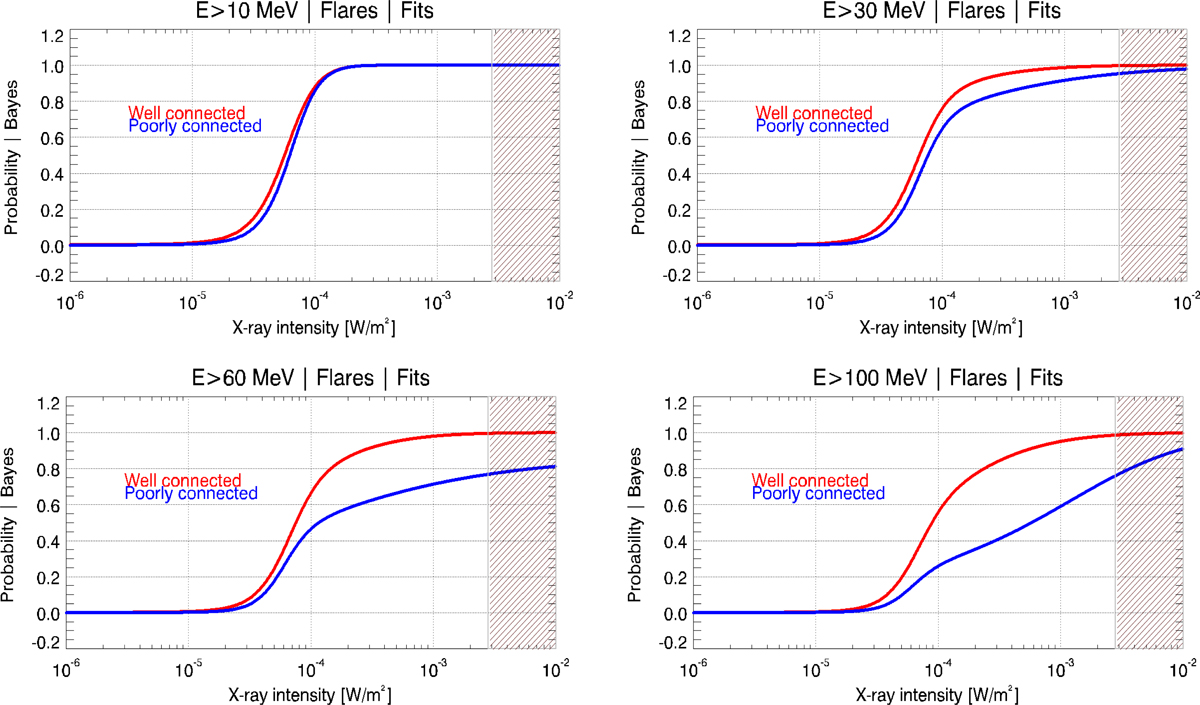
The curves for the estimation of the probability of SEP occurrence when both the SXR magnitude and the longitude of a solar flare are known. Each panel corresponds to integral energy (i.e., E > 10−; >30−; >60− and >100 MeV). Within each panel, two fits are presented, one per longitudinal bin – color-coded as: well connected (red) and poorly connected (blue) solar flares. See text for details. The gray border hatched rectangle area provides the limit for the F SXR. This is similar to Figure 6.
Current usage metrics show cumulative count of Article Views (full-text article views including HTML views, PDF and ePub downloads, according to the available data) and Abstracts Views on Vision4Press platform.
Data correspond to usage on the plateform after 2015. The current usage metrics is available 48-96 hours after online publication and is updated daily on week days.
Initial download of the metrics may take a while.