Open Access
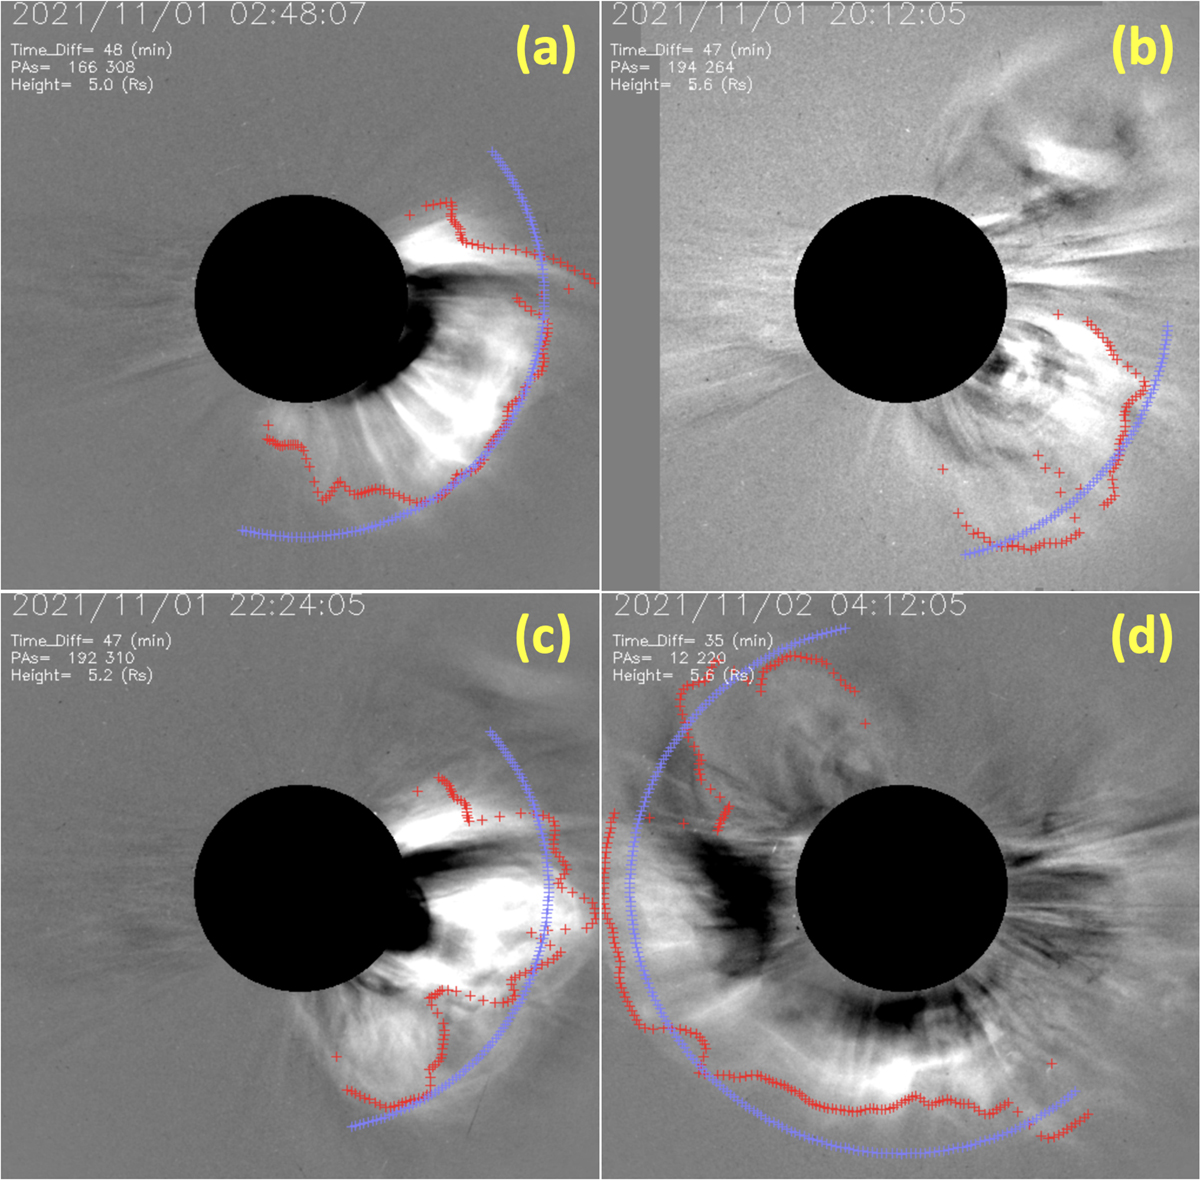
Figure 1
Download original image
Images of four CMEs between November 1st and 2nd 2021 from SOHO/LASCO C2. The individual images in (a)–(d) represent sequentially occurring events; detailed information can be found in Table 1
Current usage metrics show cumulative count of Article Views (full-text article views including HTML views, PDF and ePub downloads, according to the available data) and Abstracts Views on Vision4Press platform.
Data correspond to usage on the plateform after 2015. The current usage metrics is available 48-96 hours after online publication and is updated daily on week days.
Initial download of the metrics may take a while.