Figure 2
Download original image
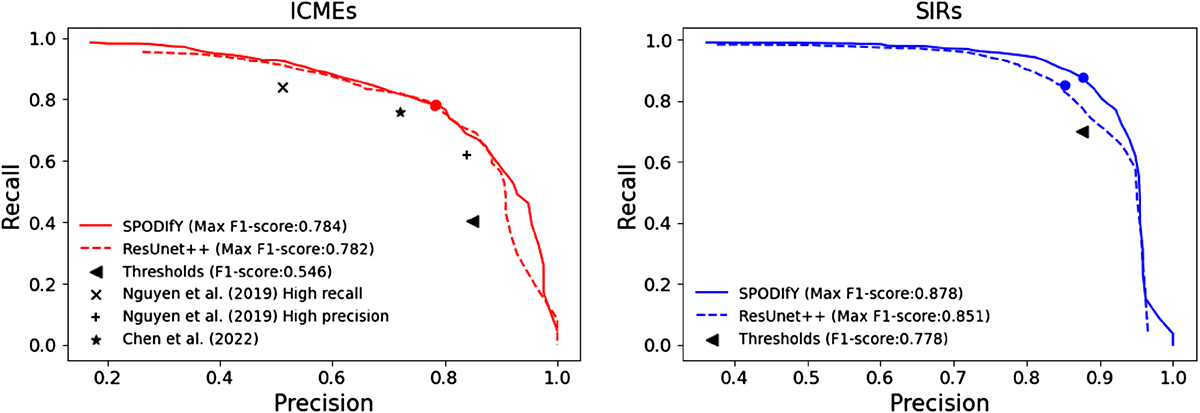
Precision-Recall curve of SPODIfY (solid lines) and ResUNet++ (dashed lines) for ICME (red, left) and SIR (blue, right) detection. The dots indicate the maximal F1-score reached by the two models for each event type and the black markers on both panel indicate the recalls and precisions obtained by the threshold-based methods, Nguyen et al. (2019) and Chen et al. (2022).
Current usage metrics show cumulative count of Article Views (full-text article views including HTML views, PDF and ePub downloads, according to the available data) and Abstracts Views on Vision4Press platform.
Data correspond to usage on the plateform after 2015. The current usage metrics is available 48-96 hours after online publication and is updated daily on week days.
Initial download of the metrics may take a while.