Figure 3
Download original image
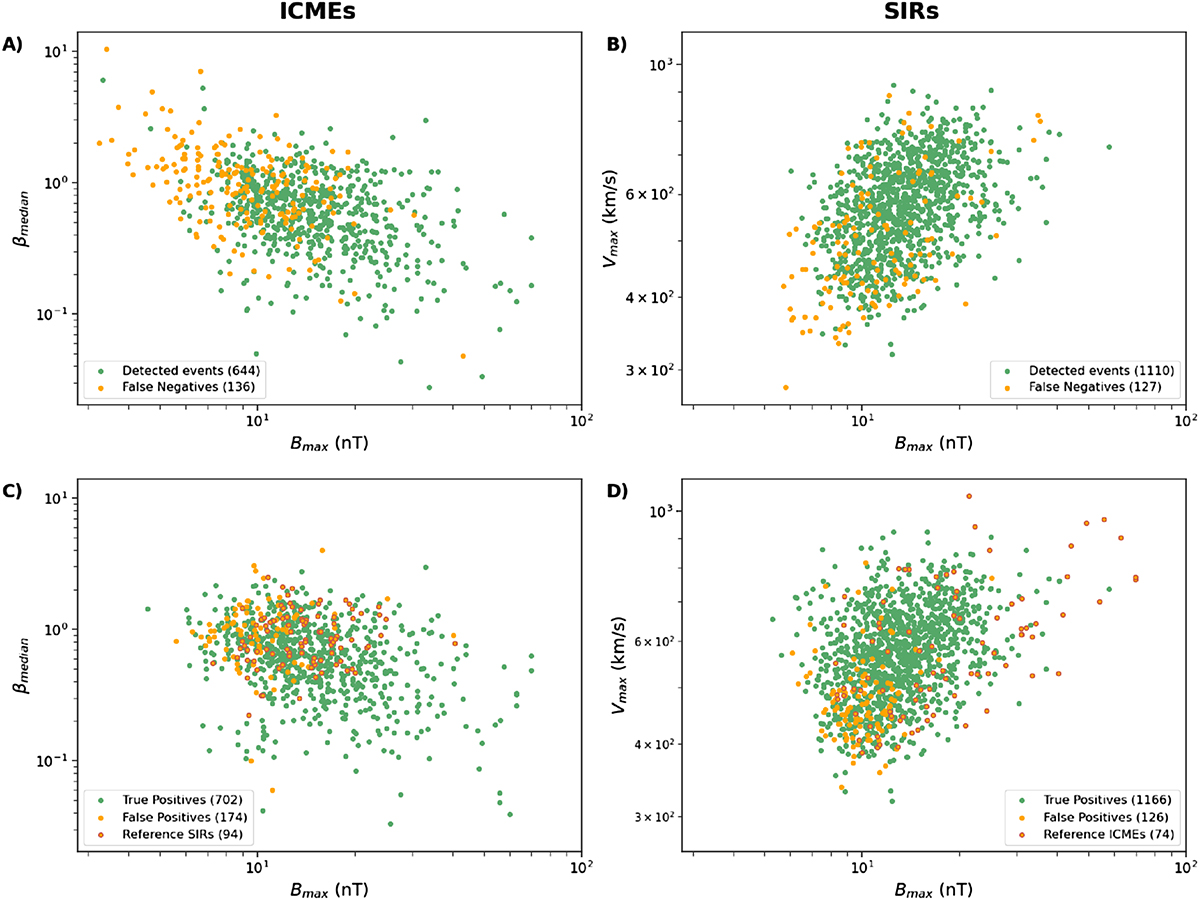
Left column: median value of the plasma β as a function of the maximal IMF amplitude Bmax for the ICMEs in the reference catalog (a) and those identified by SPODIfY (c). Right column: maximal value of the plasma bulk velocity Vmax as a function of the maximal IMF amplitude Bmax for the SIRs in the reference catalog (b) and those identified by SPODIfY (d). The green dots in the top (resp. bottom) panel represent the events detected by SPODIfY (resp. the TPs). The orange in the top (resp. bottom) panel represent the FNs (resp. the FPs). In the bottom panel, the orange dots circled in red indicate the misclassified events.
Current usage metrics show cumulative count of Article Views (full-text article views including HTML views, PDF and ePub downloads, according to the available data) and Abstracts Views on Vision4Press platform.
Data correspond to usage on the plateform after 2015. The current usage metrics is available 48-96 hours after online publication and is updated daily on week days.
Initial download of the metrics may take a while.