Figure 4
Download original image
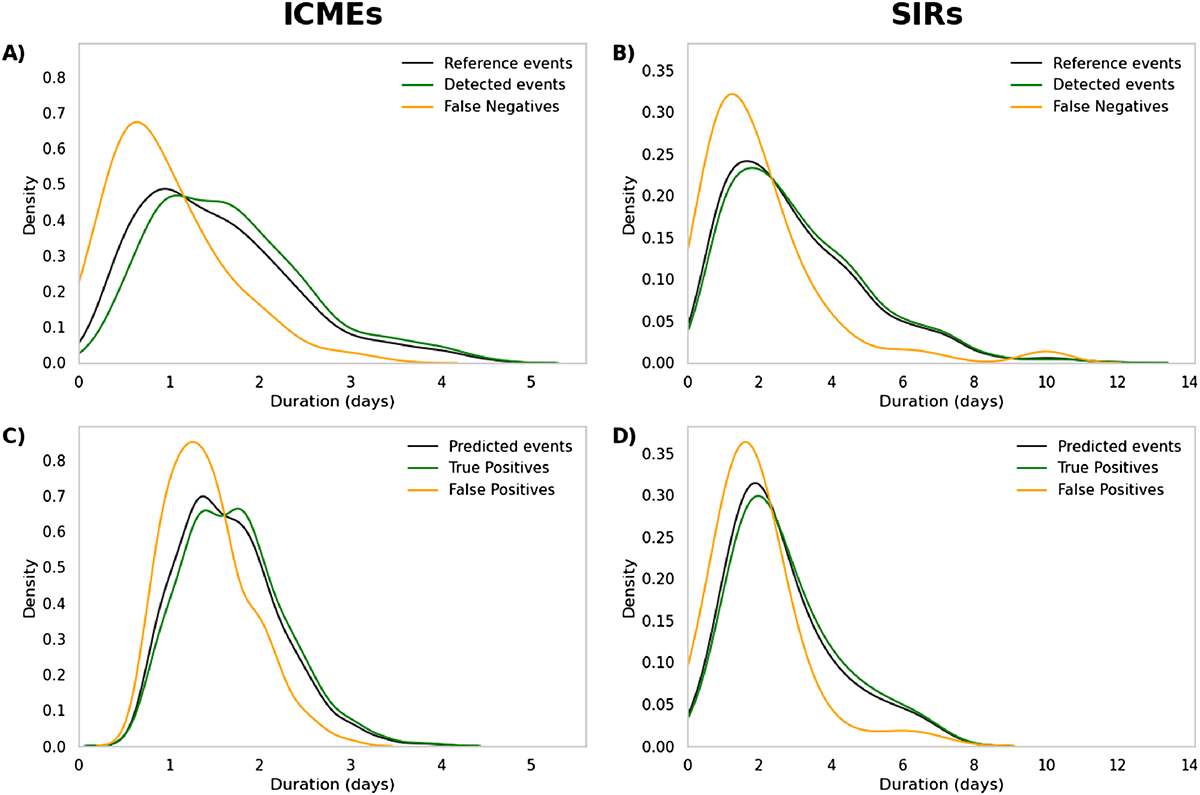
Left (resp. right) column: kernel density estimates of the ICMEs durations (resp. SIRs) in the reference catalog (top panel) and those identified by SPODIfY (bottom panel). On the top (resp. bottom) panels, the black curves refer to the entire reference catalog (resp. the entire identified catalog), the green curves refer to the detected events (resp. the TPs) and the orange curves refer to the FNs (resp. FPs).
Current usage metrics show cumulative count of Article Views (full-text article views including HTML views, PDF and ePub downloads, according to the available data) and Abstracts Views on Vision4Press platform.
Data correspond to usage on the plateform after 2015. The current usage metrics is available 48-96 hours after online publication and is updated daily on week days.
Initial download of the metrics may take a while.