Open Access
Figure 6
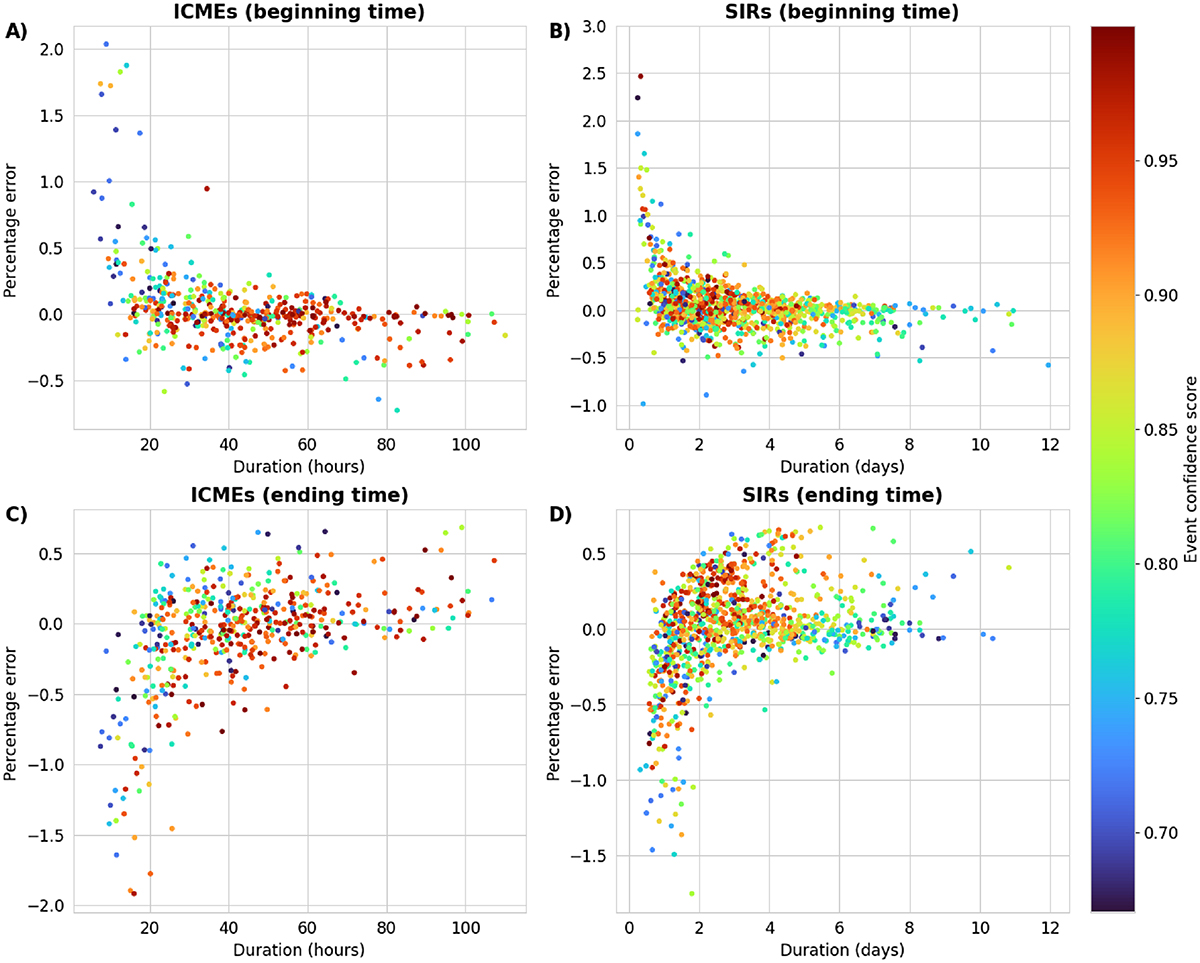
Download original image
Percentage errors on the beginning times (upper row) and ending times (bottom row) of the ICMEs (left column) and the SIRs (right column) detected by SPODIfY as a function of their duration. The colorscale indicate the confidence score with which each event is identified.
Current usage metrics show cumulative count of Article Views (full-text article views including HTML views, PDF and ePub downloads, according to the available data) and Abstracts Views on Vision4Press platform.
Data correspond to usage on the plateform after 2015. The current usage metrics is available 48-96 hours after online publication and is updated daily on week days.
Initial download of the metrics may take a while.